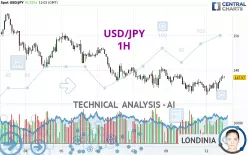
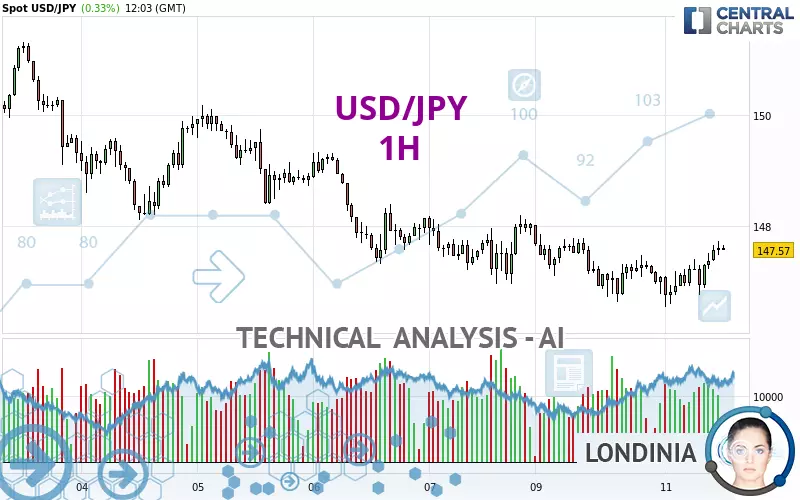
USD/JPY - 1H - Technical analysis published on 03/11/2025 (GMT)
- 67
- 0
- Who voted?
- Timeframe : 1H
- - Analysis generated on
- Status : IN PROGRESS...
Summary of the analysis

Additional analysis
Quotes
The USD/JPY price is 147.57 JPY. On the day, this instrument gained +0.33% with the lowest point at 146.54 JPY and the highest point at 147.73 JPY. The deviation from the price is +0.70% for the low point and -0.11% for the high point.So that you have an overall view of the price change, here is a table showing the variations over several periods:
Near a new LOW record (1 year)
Type : Bearish
Timeframe : Weekly
New LOW record (1st january)
Type : Bearish
Timeframe : Weekly
Near a new HIGH record (1 month)
Type : Bullish
Timeframe : Weekly
New LOW record (1 month)
Type : Bearish
Timeframe : Weekly
Technical
A technical analysis in 1H of this USD/JPY chart shows a neutral trend. The strong bullish signals currently being given by short-term moving averages could allow the overall trend to return to bullish. The Central Indicators scanner detects a bullish signal on moving averages that could impact this trend:
Bullish trend reversal : adaptative moving average 50
Type : Bullish
Timeframe : 1 hour
An assessment of technical indicators shows a strong bullish signal.
Caution: the Central Indicators scanner currently detects an excess:
CCI indicator is overbought : over 100
Type : Neutral
Timeframe : 1 hour
Williams %R indicator is overbought : over -20
Type : Neutral
Timeframe : 1 hour
MACD indicator is back over 0
Type : Bullish
Timeframe : 1 hour
The Central Patterns scanner, which studies chart patterns, resistances and supports, has identified these signals:
Near horizontal resistance
Type : Bearish
Timeframe : 1 hour
Resistance of channel is broken
Type : Bullish
Timeframe : 1 hour
No result was found by the Central Candlesticks scanner on Japanese candlesticks.
| S3 | S2 | S1 | Price | R1 | R2 | R3 | |
|---|---|---|---|---|---|---|---|
| ProTrendLines | 140.85 | 144.74 | 146.75 | 147.57 | 148.19 | 149.11 | 150.17 |
| Change (%) | -4.55% | -1.92% | -0.56% | - | +0.42% | +1.04% | +1.76% |
| Change | -6.72 | -2.83 | -0.82 | - | +0.62 | +1.54 | +2.60 |
| Level | Major | Minor | Intermediate | - | Intermediate | Minor | Intermediate |
Pivot points can also be used to set your price objectives. Here is the price situation in relation to pivot points:
| Pivot points | S3 | S2 | S1 | PP | R1 | R2 | R3 |
|---|---|---|---|---|---|---|---|
| Standard | 145.09 | 145.86 | 146.47 | 147.24 | 147.85 | 148.62 | 149.23 |
| Camarilla | 146.70 | 146.83 | 146.95 | 147.08 | 147.21 | 147.33 | 147.46 |
| Woodie | 145.01 | 145.82 | 146.39 | 147.20 | 147.77 | 148.58 | 149.15 |
| Fibonacci | 145.86 | 146.39 | 146.71 | 147.24 | 147.77 | 148.09 | 148.62 |
| Pivot points | S3 | S2 | S1 | PP | R1 | R2 | R3 |
|---|---|---|---|---|---|---|---|
| Standard | 141.86 | 144.40 | 146.22 | 148.76 | 150.58 | 153.12 | 154.94 |
| Camarilla | 146.83 | 147.23 | 147.63 | 148.03 | 148.43 | 148.83 | 149.23 |
| Woodie | 141.49 | 144.22 | 145.85 | 148.58 | 150.21 | 152.94 | 154.57 |
| Fibonacci | 144.40 | 146.07 | 147.10 | 148.76 | 150.43 | 151.46 | 153.12 |
| Pivot points | S3 | S2 | S1 | PP | R1 | R2 | R3 |
|---|---|---|---|---|---|---|---|
| Standard | 140.15 | 144.36 | 147.47 | 151.68 | 154.79 | 159.00 | 162.11 |
| Camarilla | 148.57 | 149.24 | 149.91 | 150.58 | 151.25 | 151.92 | 152.59 |
| Woodie | 139.60 | 144.09 | 146.92 | 151.41 | 154.24 | 158.73 | 161.56 |
| Fibonacci | 144.36 | 147.16 | 148.88 | 151.68 | 154.48 | 156.20 | 159.00 |
Numerical data
The following is the status of the technical indicators and moving averages at the time of publication of this technical analysis:
| RSI (14): | 60.54 | |
| MACD (12,26,9): | 0.0400 | |
| Directional Movement: | -0.56 | |
| AROON (14): | 78.57 | |
| DEMA (21): | 147.24 | |
| Parabolic SAR (0,02-0,02-0,2): | 146.69 | |
| Elder Ray (13): | 0.34 | |
| Super Trend (3,10): | 147.75 | |
| Zig ZAG (10): | 147.66 | |
| VORTEX (21): | 1.1300 | |
| Stochastique (14,3,5): | 90.23 | |
| TEMA (21): | 147.38 | |
| Williams %R (14): | -3.39 | |
| Chande Momentum Oscillator (20): | 0.60 | |
| Repulse (5,40,3): | 0.2500 | |
| ROCnROLL: | 1 | |
| TRIX (15,9): | -0.0100 | |
| Courbe Coppock: | 0.28 |
| MA7: | 148.42 | |
| MA20: | 150.02 | |
| MA50: | 153.38 | |
| MA100: | 153.39 | |
| MAexp7: | 147.38 | |
| MAexp20: | 147.24 | |
| MAexp50: | 147.39 | |
| MAexp100: | 147.81 | |
| Price / MA7: | -0.57% | |
| Price / MA20: | -1.63% | |
| Price / MA50: | -3.79% | |
| Price / MA100: | -3.79% | |
| Price / MAexp7: | +0.13% | |
| Price / MAexp20: | +0.22% | |
| Price / MAexp50: | +0.12% | |
| Price / MAexp100: | -0.16% |
News
The latest news and videos published on USD/JPY at the time of the analysis were as follows:
-
 USD/JPY Analysis: The Dollar Continues to Drop Against the JPY
-
USD/JPY Analysis: Dollar Struggles with Yen
-
USD/JPY Analysis: Can the Dollar Break 151 JPY?
-
USD/JPY Analysis: The USD Continues to Hang On
-
USD/JPY Analysis: US Dollar Plunges Against the Yen
About author

Online


Add a comment
Comments
0 comments on the analysis USD/JPY - 1H