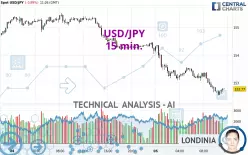
USD/JPY - 15 min. - Technical analysis published on 02/05/2025 (GMT)
- 77
- 0
Click here for a new analysis!
- Timeframe : 15 min.
- - Analysis generated on
- Status : TARGET REACHED

Summary of the analysis

Additional analysis
Quotes
USD/JPY rating 152.77 JPY. On the day, this instrument lost -0.89% and was traded between 152.55 JPY and 154.36 JPY over the period. The price is currently at +0.14% from its lowest and -1.03% from its highest.Here is a more detailed summary of the historical variations registered by USD/JPY:
Near a new HIGH record (5 years)
Type : Bullish
Timeframe : Weekly
Near a new HIGH record (1 year)
Type : Bullish
Timeframe : Weekly
Near a new HIGH record (1st january)
Type : Bullish
Timeframe : Weekly
New LOW record (1st january)
Type : Bearish
Timeframe : Weekly
Near a new HIGH record (1 month)
Type : Bullish
Timeframe : Weekly
New LOW record (1 month)
Type : Bearish
Timeframe : Weekly
Technical
A technical analysis in 15 min. of this USD/JPY chart shows a sharp bearish trend. 92.86% of the signals given by moving averages are bearish. The overall trend is supported by the strong bearish signals from short-term moving averages. The Central Indicators market scanner currently does not detect any result that concerns moving averages.
In fact, 11 technical indicators on 18 studied are currently positioned bearish. But beware of excesses. The Central Indicators scanner currently detects this:
CCI indicator is oversold : under -100
Type : Neutral
Timeframe : 15 minutes
Williams %R indicator is oversold : under -80
Type : Neutral
Timeframe : 15 minutes
Pivot points : price is under support 1
Type : Neutral
Timeframe : Weekly
Pivot points : price is under support 3
Type : Neutral
Timeframe : 15 minutes
No signals are given by Central Patterns, a market scanner specialised in chart patterns, resistances and supports.
The Central Candlesticks scanner which studies Japanese candlesticks did not detect anything.
| S3 | S2 | S1 | Price | R1 | R2 | R3 | |
|---|---|---|---|---|---|---|---|
| ProTrendLines | 144.74 | 146.75 | 150.17 | 152.77 | 153.79 | 154.01 | 155.00 |
| Change (%) | -5.26% | -3.94% | -1.70% | - | +0.67% | +0.81% | +1.46% |
| Change | -8.03 | -6.02 | -2.60 | - | +1.02 | +1.24 | +2.23 |
| Level | Minor | Minor | Major | - | Intermediate | Intermediate | Minor |
Pivot points can also be used to set your price objectives. Here is the price situation in relation to pivot points:
| Pivot points | S3 | S2 | S1 | PP | R1 | R2 | R3 |
|---|---|---|---|---|---|---|---|
| Standard | 152.13 | 153.09 | 153.61 | 154.57 | 155.09 | 156.05 | 156.57 |
| Camarilla | 153.73 | 153.87 | 154.00 | 154.14 | 154.28 | 154.41 | 154.55 |
| Woodie | 151.92 | 152.98 | 153.40 | 154.46 | 154.88 | 155.94 | 156.36 |
| Fibonacci | 153.09 | 153.65 | 154.00 | 154.57 | 155.13 | 155.48 | 156.05 |
| Pivot points | S3 | S2 | S1 | PP | R1 | R2 | R3 |
|---|---|---|---|---|---|---|---|
| Standard | 151.28 | 152.49 | 153.82 | 155.03 | 156.36 | 157.57 | 158.90 |
| Camarilla | 154.44 | 154.67 | 154.91 | 155.14 | 155.37 | 155.61 | 155.84 |
| Woodie | 151.33 | 152.52 | 153.87 | 155.06 | 156.41 | 157.60 | 158.95 |
| Fibonacci | 152.49 | 153.46 | 154.06 | 155.03 | 156.00 | 156.60 | 157.57 |
| Pivot points | S3 | S2 | S1 | PP | R1 | R2 | R3 |
|---|---|---|---|---|---|---|---|
| Standard | 147.77 | 150.74 | 152.94 | 155.91 | 158.11 | 161.08 | 163.28 |
| Camarilla | 153.72 | 154.19 | 154.67 | 155.14 | 155.61 | 156.09 | 156.56 |
| Woodie | 147.39 | 150.55 | 152.56 | 155.72 | 157.73 | 160.89 | 162.90 |
| Fibonacci | 150.74 | 152.72 | 153.94 | 155.91 | 157.89 | 159.11 | 161.08 |
Numerical data
The following are the details of the technical indicators and moving averages that were collected to generate this technical analysis:
| RSI (14): | 30.68 | |
| MACD (12,26,9): | -0.2200 | |
| Directional Movement: | -25.05 | |
| AROON (14): | -64.29 | |
| DEMA (21): | 152.73 | |
| Parabolic SAR (0,02-0,02-0,2): | 153.11 | |
| Elder Ray (13): | -0.29 | |
| Super Trend (3,10): | 153.10 | |
| Zig ZAG (10): | 152.61 | |
| VORTEX (21): | 0.7500 | |
| Stochastique (14,3,5): | 5.05 | |
| TEMA (21): | 152.68 | |
| Williams %R (14): | -94.05 | |
| Chande Momentum Oscillator (20): | -0.63 | |
| Repulse (5,40,3): | -0.1300 | |
| ROCnROLL: | 2 | |
| TRIX (15,9): | -0.0200 | |
| Courbe Coppock: | 0.71 |
| MA7: | 154.57 | |
| MA20: | 155.78 | |
| MA50: | 154.84 | |
| MA100: | 152.42 | |
| MAexp7: | 152.73 | |
| MAexp20: | 153.01 | |
| MAexp50: | 153.41 | |
| MAexp100: | 153.88 | |
| Price / MA7: | -1.16% | |
| Price / MA20: | -1.93% | |
| Price / MA50: | -1.34% | |
| Price / MA100: | +0.23% | |
| Price / MAexp7: | +0.03% | |
| Price / MAexp20: | -0.16% | |
| Price / MAexp50: | -0.42% | |
| Price / MAexp100: | -0.72% |
News
The last news published on USD/JPY at the time of the generation of this analysis was as follows:
-
 Michael Kramer @Themarketchronicles | BoJ rate decision set to impact USD/JPY
-
USD/JPY Outlook: Can the Dollar Continue Higher?
-
USD/JPY Price Forecast - Chaos on Friday
-
USD/JPY Price Forecast - US Dollar Likely to Continue Punishing the Yen
-
USD/JPY Price Forecast - US Dollar Continues to Hit Ceiling (January 8, 2025 Forecast)
About author

Online


Add a comment
Comments
0 comments on the analysis USD/JPY - 15 min.