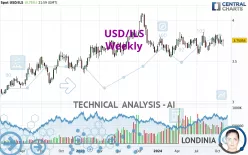
USD/ILS - Weekly - Technical analysis published on 11/10/2024 (GMT)
- 410
- 0
Click here for a new analysis!
- Timeframe : Weekly
- - Analysis generated on
- Status : INVALID

Summary of the analysis

Additional analysis
Quotes
The USD/ILS rating is 3.75054 ILS. The price registered an increase of +0.03% over 5 days with the lowest point at 3.68074 ILS and the highest point at 3.76865 ILS. The deviation from the price is +1.90% for the low point and -0.48% for the high point.So that you have an overall view of the price change, here is a table showing the variations over several periods:
Near a new LOW record (1 year)
Type : Bearish
Timeframe : Weekly
Near a new LOW record (1st january)
Type : Bearish
Timeframe : Weekly
Near a new HIGH record (1 month)
Type : Bullish
Timeframe : Weekly
Technical
Technical analysis of USD/ILS in Weekly shows a strongly overall bullish trend. 89.29% of the signals given by moving averages are bullish. The slightly bullish signals given by the short-term moving averages show a weakening of the global trend. The Central Indicators market scanner is currently detecting a bullish signal that could impact this trend:
Bullish trend reversal : Moving Average 50
Type : Bullish
Timeframe : Weekly
In fact, only 9 technical indicators out of 18 studied are currently bullish. Central Indicators, the detector scanner for these technical indicators has recently detected several signals:
Parabolic SAR indicator bearish reversal
Type : Bearish
Timeframe : Weekly
Aroon indicator bearish trend
Type : Bearish
Timeframe : Weekly
Central Patterns, the market scanner focusing on chart patterns, resistances and supports found these results:
Near resistance of channel
Type : Bearish
Timeframe : Weekly
Near support of triangle
Type : Bullish
Timeframe : Weekly
The Central Candlesticks scanner currently notes the presence of this pattern in Japanese candlesticks that could mark the end of the short-term trend currently underway:
Doji
Type : Neutral
Timeframe : Weekly
| S3 | S2 | S1 | Price | R1 | R2 | R3 | |
|---|---|---|---|---|---|---|---|
| ProTrendLines | 3.23685 | 3.39160 | 3.55715 | 3.75054 | 3.81087 | 3.98156 | 4.07735 |
| Change (%) | -13.70% | -9.57% | -5.16% | - | +1.61% | +6.16% | +8.71% |
| Change | -0.51369 | -0.35894 | -0.19339 | - | +0.06033 | +0.23102 | +0.32681 |
| Level | Intermediate | Intermediate | Major | - | Major | Minor | Major |
To determine price objectives, it is also possible to use the pivot points. Here is the price position in relation to pivot points:
| Pivot points | S3 | S2 | S1 | PP | R1 | R2 | R3 |
|---|---|---|---|---|---|---|---|
| Standard | 3.68384 | 3.70026 | 3.72540 | 3.74182 | 3.76696 | 3.78338 | 3.80852 |
| Camarilla | 3.73911 | 3.74292 | 3.74673 | 3.75054 | 3.75435 | 3.75816 | 3.76197 |
| Woodie | 3.68820 | 3.70244 | 3.72976 | 3.74400 | 3.77132 | 3.78556 | 3.81288 |
| Fibonacci | 3.70026 | 3.71614 | 3.72594 | 3.74182 | 3.75770 | 3.76750 | 3.78338 |
| Pivot points | S3 | S2 | S1 | PP | R1 | R2 | R3 |
|---|---|---|---|---|---|---|---|
| Standard | 3.64421 | 3.67157 | 3.71058 | 3.73794 | 3.77695 | 3.80431 | 3.84332 |
| Camarilla | 3.73135 | 3.73743 | 3.74352 | 3.74960 | 3.75568 | 3.76177 | 3.76785 |
| Woodie | 3.65005 | 3.67448 | 3.71642 | 3.74085 | 3.78279 | 3.80722 | 3.84916 |
| Fibonacci | 3.67157 | 3.69692 | 3.71258 | 3.73794 | 3.76329 | 3.77895 | 3.80431 |
| Pivot points | S3 | S2 | S1 | PP | R1 | R2 | R3 |
|---|---|---|---|---|---|---|---|
| Standard | 3.55083 | 3.62487 | 3.68328 | 3.75732 | 3.81573 | 3.88977 | 3.94818 |
| Camarilla | 3.70526 | 3.71740 | 3.72954 | 3.74168 | 3.75382 | 3.76596 | 3.77810 |
| Woodie | 3.54301 | 3.62096 | 3.67546 | 3.75341 | 3.80791 | 3.88586 | 3.94036 |
| Fibonacci | 3.62487 | 3.67547 | 3.70673 | 3.75732 | 3.80792 | 3.83918 | 3.88977 |
Numerical data
The following is the status of technical indicators and moving averages registered at the time this technical analysis was created:
| RSI (14): | 51.65 | |
| MACD (12,26,9): | 0.0149 | |
| Directional Movement: | 0.74690 | |
| AROON (14): | -21.42857 | |
| DEMA (21): | 3.75074 | |
| Parabolic SAR (0,02-0,02-0,2): | 3.85404 | |
| Elder Ray (13): | -0.01772 | |
| Super Trend (3,10): | 3.83899 | |
| Zig ZAG (10): | 3.75054 | |
| VORTEX (21): | 0.9691 | |
| Stochastique (14,3,5): | 61.74 | |
| TEMA (21): | 3.76326 | |
| Williams %R (14): | -44.78 | |
| Chande Momentum Oscillator (20): | 0.08382 | |
| Repulse (5,40,3): | 2.4121 | |
| ROCnROLL: | 1 | |
| TRIX (15,9): | 0.0379 | |
| Courbe Coppock: | 3.23 |
| MA7: | 3.73920 | |
| MA20: | 3.74963 | |
| MA50: | 3.74909 | |
| MA100: | 3.72807 | |
| MAexp7: | 3.75304 | |
| MAexp20: | 3.73408 | |
| MAexp50: | 3.71476 | |
| MAexp100: | 3.66427 | |
| Price / MA7: | +0.30% | |
| Price / MA20: | +0.02% | |
| Price / MA50: | +0.04% | |
| Price / MA100: | +0.60% | |
| Price / MAexp7: | -0.07% | |
| Price / MAexp20: | +0.44% | |
| Price / MAexp50: | +0.96% | |
| Price / MAexp100: | +2.35% |
News
The latest news and videos published on USD/ILS at the time of the analysis were as follows:
About author

Online


Add a comment
Comments
0 comments on the analysis USD/ILS - Weekly