| Open: | 6.9083 |
| Change: | -0.0128 |
| Volume: | 122,159 |
| Low: | 6.8801 |
| High: | 6.9314 |
| High / Low range: | 0.0513 |
| Type: | Forex |
| Ticker: | USDDKK |
| ISIN: |
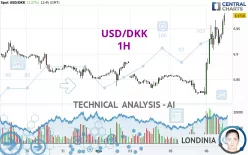
USD/DKK - 1H - Technical analysis published on 11/06/2024 (GMT)
- 116
- 0
- 11/06/2024 - 12:45
Click here for a new analysis!
- Timeframe : 1H
- - Analysis generated on 11/06/2024 - 12:45
- Status : LEVEL MAINTAINED

Summary of the analysis

Additional analysis
Quotes
The USD/DKK rating is 6.9757 DKK. On the day, this instrument gained +2.27% and was traded between 6.8209 DKK and 6.9804 DKK over the period. The price is currently at +2.27% from its lowest and -0.07% from its highest.Here is a more detailed summary of the historical variations registered by USD/DKK:
Near a new LOW record (1 year)
Type : Bearish
Timeframe : Weekly
Near a new LOW record (1st january)
Type : Bearish
Timeframe : Weekly
New HIGH record (1 month)
Type : Bullish
Timeframe : Weekly
Technical
A technical analysis in 1H of this USD/DKK chart shows a strongly bullish trend. 92.86% of the signals given by moving averages are bullish. The overall trend is supported by the strong bullish signals from short-term moving averages. The Central Indicators market scanner currently does not detect any result that concerns moving averages.
In fact, 16 technical indicators on 18 studied are currently bullish. Caution: the Central Indicators scanner currently detects an excess:
RSI indicator is overbought : over 70
Type : Neutral
Timeframe : 1 hour
CCI indicator is overbought : over 100
Type : Neutral
Timeframe : 1 hour
Williams %R indicator is overbought : over -20
Type : Neutral
Timeframe : 1 hour
Pivot points : price is over resistance 2
Type : Neutral
Timeframe : Weekly
Pivot points : price is over resistance 3
Type : Neutral
Timeframe : 1 hour
Central Patterns, the market scanner focusing on chart patterns, resistances and supports found these results:
Horizontal resistance is broken
Type : Bullish
Timeframe : 1 hour
Resistance of channel is broken
Type : Bullish
Timeframe : 1 hour
No result was found by the Central Candlesticks scanner on Japanese candlesticks.
| S3 | S2 | S1 | Price | R1 | R2 | R3 | |
|---|---|---|---|---|---|---|---|
| ProTrendLines | 6.8992 | 6.9165 | 6.9262 | 6.9757 | 6.9842 | 7.0249 | 7.1394 |
| Change (%) | -1.10% | -0.85% | -0.71% | - | +0.12% | +0.71% | +2.35% |
| Change | -0.0765 | -0.0592 | -0.0495 | - | +0.0085 | +0.0492 | +0.1637 |
| Level | Minor | Major | Minor | - | Minor | Minor | Major |
Pivot points can also be used to set your price objectives. Here is the price situation in relation to pivot points:
| Pivot points | S3 | S2 | S1 | PP | R1 | R2 | R3 |
|---|---|---|---|---|---|---|---|
| Standard | 6.7664 | 6.7927 | 6.8068 | 6.8331 | 6.8472 | 6.8735 | 6.8876 |
| Camarilla | 6.8098 | 6.8135 | 6.8172 | 6.8209 | 6.8246 | 6.8283 | 6.8320 |
| Woodie | 6.7603 | 6.7897 | 6.8007 | 6.8301 | 6.8411 | 6.8705 | 6.8815 |
| Fibonacci | 6.7927 | 6.8081 | 6.8177 | 6.8331 | 6.8485 | 6.8581 | 6.8735 |
| Pivot points | S3 | S2 | S1 | PP | R1 | R2 | R3 |
|---|---|---|---|---|---|---|---|
| Standard | 6.7496 | 6.7933 | 6.8389 | 6.8826 | 6.9282 | 6.9719 | 7.0175 |
| Camarilla | 6.8600 | 6.8682 | 6.8764 | 6.8846 | 6.8928 | 6.9010 | 6.9092 |
| Woodie | 6.7507 | 6.7938 | 6.8400 | 6.8831 | 6.9293 | 6.9724 | 7.0186 |
| Fibonacci | 6.7933 | 6.8274 | 6.8485 | 6.8826 | 6.9167 | 6.9378 | 6.9719 |
| Pivot points | S3 | S2 | S1 | PP | R1 | R2 | R3 |
|---|---|---|---|---|---|---|---|
| Standard | 6.4767 | 6.5830 | 6.7182 | 6.8245 | 6.9597 | 7.0660 | 7.2012 |
| Camarilla | 6.7870 | 6.8091 | 6.8313 | 6.8534 | 6.8755 | 6.8977 | 6.9198 |
| Woodie | 6.4912 | 6.5902 | 6.7327 | 6.8317 | 6.9742 | 7.0732 | 7.2157 |
| Fibonacci | 6.5830 | 6.6753 | 6.7323 | 6.8245 | 6.9168 | 6.9738 | 7.0660 |
Numerical data
The following is the status of technical indicators and moving averages registered at the time this technical analysis was created:
| RSI (14): | 72.79 | |
| MACD (12,26,9): | 0.0295 | |
| Directional Movement: | 33.3852 | |
| AROON (14): | 92.8571 | |
| DEMA (21): | 6.9457 | |
| Parabolic SAR (0,02-0,02-0,2): | 6.9206 | |
| Elder Ray (13): | 0.0411 | |
| Super Trend (3,10): | 6.9008 | |
| Zig ZAG (10): | 6.9734 | |
| VORTEX (21): | 1.2632 | |
| Stochastique (14,3,5): | 91.14 | |
| TEMA (21): | 6.9668 | |
| Williams %R (14): | -3.53 | |
| Chande Momentum Oscillator (20): | 0.0925 | |
| Repulse (5,40,3): | 0.5958 | |
| ROCnROLL: | 1 | |
| TRIX (15,9): | 0.0469 | |
| Courbe Coppock: | 3.28 |
| MA7: | 6.8798 | |
| MA20: | 6.8767 | |
| MA50: | 6.7909 | |
| MA100: | 6.8195 | |
| MAexp7: | 6.9474 | |
| MAexp20: | 6.9106 | |
| MAexp50: | 6.8814 | |
| MAexp100: | 6.8736 | |
| Price / MA7: | +1.39% | |
| Price / MA20: | +1.44% | |
| Price / MA50: | +2.72% | |
| Price / MA100: | +2.29% | |
| Price / MAexp7: | +0.41% | |
| Price / MAexp20: | +0.94% | |
| Price / MAexp50: | +1.37% | |
| Price / MAexp100: | +1.49% |
News
Don't forget to follow the news on USD/DKK. At the time of publication of this analysis, the latest news was as follows:
-
09/10/2024 - 16:28
 USD/DKK Forecast September 11, 2024
About author
Online


Add a comment
Comments
0 comments on the analysis USD/DKK - 1H