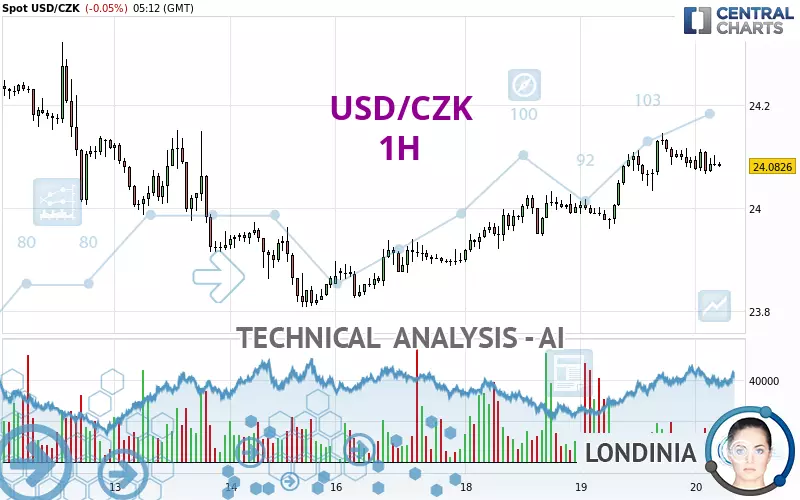
USD/CZK - 1H - Technical analysis published on 02/20/2025 (GMT)
- 114
- 0
Click here for a new analysis!
- Timeframe : 1H
- - Analysis generated on
- Status : INVALID

Summary of the analysis

Additional analysis
Quotes
The USD/CZK price is 24.0824 CZK. On the day, this instrument lost -0.05% and was between 24.0667 CZK and 24.1144 CZK. This implies that the price is at +0.07% from its lowest and at -0.13% from its highest.The Central Gaps scanner detects a bullish opening marking the presence of buyers ahead of sellers at the opening but not sufficiently marked to allow the price to register a quotation gap.
Bullish opening
Type : Bullish
Timeframe : Openning
Here is a more detailed summary of the historical variations registered by USD/CZK:
Near a new HIGH record (1 year)
Type : Bullish
Timeframe : Weekly
Near a new HIGH record (1st january)
Type : Bullish
Timeframe : Weekly
Near a new HIGH record (1 month)
Type : Bullish
Timeframe : Weekly
Technical
Technical analysis of this 1H chart of USD/CZK indicates that the overall trend is strongly bullish. 85.71% of the signals given by moving averages are bullish. The slightly bullish signals given by the short-term moving averages indicate this trend is showing signs of running out of steam. The Central Indicators market scanner currently does not detect any result that concerns moving averages.
In fact, Central Analyzer took into account 18 technical indicators and the result was as follows: 5 are bullish, 5 are neutral and 8 are bearish. Central Indicators, the detector scanner for these technical indicators has recently detected several signals:
Price is back over the pivot point
Type : Bullish
Timeframe : Weekly
Momentum indicator is back under 0
Type : Bearish
Timeframe : 1 hour
Central Patterns, the market scanner focusing on chart patterns, resistances and supports found this result:
Near support of channel
Type : Bullish
Timeframe : 1 hour
The Central Candlesticks scanner, specialised in Japanese candlesticks, did not identify any signals.
| S3 | S2 | S1 | Price | R1 | R2 | R3 | |
|---|---|---|---|---|---|---|---|
| ProTrendLines | 23.8836 | 23.9415 | 24.0332 | 24.0824 | 24.1831 | 24.2638 | 24.3665 |
| Change (%) | -0.83% | -0.59% | -0.20% | - | +0.42% | +0.75% | +1.18% |
| Change | -0.1988 | -0.1409 | -0.0492 | - | +0.1007 | +0.1814 | +0.2841 |
| Level | Intermediate | Minor | Intermediate | - | Major | Minor | Minor |
To determine price objectives, it is also possible to use the pivot points. Here is the price position in relation to pivot points:
| Pivot points | S3 | S2 | S1 | PP | R1 | R2 | R3 |
|---|---|---|---|---|---|---|---|
| Standard | 23.8017 | 23.8808 | 23.9875 | 24.0666 | 24.1733 | 24.2524 | 24.3591 |
| Camarilla | 24.0430 | 24.0600 | 24.0771 | 24.0941 | 24.1111 | 24.1282 | 24.1452 |
| Woodie | 23.8154 | 23.8877 | 24.0012 | 24.0735 | 24.1870 | 24.2593 | 24.3728 |
| Fibonacci | 23.8808 | 23.9518 | 23.9957 | 24.0666 | 24.1376 | 24.1815 | 24.2524 |
| Pivot points | S3 | S2 | S1 | PP | R1 | R2 | R3 |
|---|---|---|---|---|---|---|---|
| Standard | 23.0254 | 23.4167 | 23.6410 | 24.0323 | 24.2566 | 24.6479 | 24.8722 |
| Camarilla | 23.6960 | 23.7524 | 23.8089 | 23.8653 | 23.9217 | 23.9782 | 24.0346 |
| Woodie | 22.9419 | 23.3750 | 23.5575 | 23.9906 | 24.1731 | 24.6062 | 24.7887 |
| Fibonacci | 23.4167 | 23.6519 | 23.7971 | 24.0323 | 24.2675 | 24.4127 | 24.6479 |
| Pivot points | S3 | S2 | S1 | PP | R1 | R2 | R3 |
|---|---|---|---|---|---|---|---|
| Standard | 22.8890 | 23.3597 | 23.8202 | 24.2909 | 24.7514 | 25.2221 | 25.6826 |
| Camarilla | 24.0246 | 24.1100 | 24.1953 | 24.2807 | 24.3661 | 24.4514 | 24.5368 |
| Woodie | 22.8839 | 23.3572 | 23.8151 | 24.2884 | 24.7463 | 25.2196 | 25.6775 |
| Fibonacci | 23.3597 | 23.7154 | 23.9352 | 24.2909 | 24.6466 | 24.8664 | 25.2221 |
Numerical data
The following is the status of technical indicators and moving averages registered at the time this technical analysis was created:
| RSI (14): | 55.07 | |
| MACD (12,26,9): | 0.0180 | |
| Directional Movement: | 4.4875 | |
| AROON (14): | 14.2857 | |
| DEMA (21): | 24.1066 | |
| Parabolic SAR (0,02-0,02-0,2): | 24.1201 | |
| Elder Ray (13): | 0.0056 | |
| Super Trend (3,10): | 24.0318 | |
| Zig ZAG (10): | 24.0897 | |
| VORTEX (21): | 1.1632 | |
| Stochastique (14,3,5): | 43.30 | |
| TEMA (21): | 24.0998 | |
| Williams %R (14): | -50.66 | |
| Chande Momentum Oscillator (20): | -0.0426 | |
| Repulse (5,40,3): | -0.0518 | |
| ROCnROLL: | 1 | |
| TRIX (15,9): | 0.0150 | |
| Courbe Coppock: | 0.06 |
| MA7: | 23.9986 | |
| MA20: | 24.1253 | |
| MA50: | 24.1947 | |
| MA100: | 23.8828 | |
| MAexp7: | 24.0884 | |
| MAexp20: | 24.0793 | |
| MAexp50: | 24.0384 | |
| MAexp100: | 24.0218 | |
| Price / MA7: | +0.35% | |
| Price / MA20: | -0.18% | |
| Price / MA50: | -0.46% | |
| Price / MA100: | +0.84% | |
| Price / MAexp7: | -0.02% | |
| Price / MAexp20: | +0.01% | |
| Price / MAexp50: | +0.18% | |
| Price / MAexp100: | +0.25% |
About author

Online


Add a comment
Comments
0 comments on the analysis USD/CZK - 1H