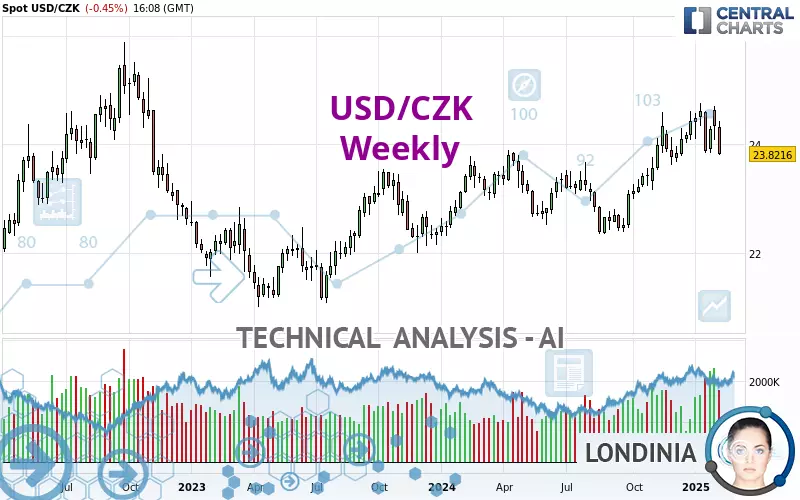
USD/CZK - Weekly - Technical analysis published on 02/14/2025 (GMT)
- 81
- 0
- Timeframe : Weekly
- - Analysis generated on
- Status : IN PROGRESS...
Summary of the analysis

Additional analysis
Quotes
USD/CZK rating 23.8224 CZK. The price is lower by -2.11% over the 5 days and has been traded over the last 5 days between 23.8088 CZK and 24.4236 CZK. This implies that the 5 day price is +0.06% from its lowest point and -2.46% from its highest point.So that you have an overall view of the price change, here is a table showing the variations over several periods:
Near a new HIGH record (1 year)
Type : Bullish
Timeframe : Weekly
Near a new HIGH record (1st january)
Type : Bullish
Timeframe : Weekly
New LOW record (1st january)
Type : Bearish
Timeframe : Weekly
Near a new HIGH record (1 month)
Type : Bullish
Timeframe : Weekly
New LOW record (1 month)
Type : Bearish
Timeframe : Weekly
Technical
Technical analysis of this Weekly chart of USD/CZK indicates that the overall trend is bullish. 75.00% of the signals given by moving averages are bullish. Caution: the neutral signals currently given by the short-term moving averages indicate that this bullish trend is showing signs of running out of steam. An assessment of moving averages reveals a bearish signal that could impact this trend:
Bearish price crossover with Moving Average 20
Type : Bearish
Timeframe : Weekly
On the 18 technical indicators analysed, 7 are bullish, 6 are neutral and 5 are bearish. Central Indicators, the scanner specialised in technical indicators, has identified these signals:
Pivot points : price is under support 1
Type : Neutral
Timeframe : Weekly
MACD crosses DOWN its Moving Average
Type : Bearish
Timeframe : Weekly
Momentum indicator is back under 0
Type : Bearish
Timeframe : Weekly
Williams %R indicator is back under -50
Type : Bearish
Timeframe : Weekly
No signals are given by Central Patterns, a market scanner specialised in chart patterns, resistances and supports.
For a small setback in the very short term, the Central Candlesticks scanner currently notes the presence of this bearish pattern in Japanese candlesticks:
Black evening star
Type : Bearish
Timeframe : Weekly
| S3 | S2 | S1 | Price | R1 | R2 | |
|---|---|---|---|---|---|---|
| ProTrendLines | 21.8682 | 22.3794 | 23.4430 | 23.8224 | 24.4900 | 26.0304 |
| Change (%) | -8.20% | -6.06% | -1.59% | - | +2.80% | +9.27% |
| Change | -1.9542 | -1.4430 | -0.3794 | - | +0.6676 | +2.2080 |
| Level | Minor | Intermediate | Major | - | Major | Major |
To determine price objectives, it is also possible to use the pivot points. Here is the price position in relation to pivot points:
| Pivot points | S3 | S2 | S1 | PP | R1 | R2 | R3 |
|---|---|---|---|---|---|---|---|
| Standard | 23.6061 | 23.7602 | 23.8441 | 23.9982 | 24.0821 | 24.2362 | 24.3201 |
| Camarilla | 23.8627 | 23.8845 | 23.9063 | 23.9281 | 23.9499 | 23.9717 | 23.9936 |
| Woodie | 23.5711 | 23.7427 | 23.8091 | 23.9807 | 24.0471 | 24.2187 | 24.2851 |
| Fibonacci | 23.7602 | 23.8511 | 23.9073 | 23.9982 | 24.0891 | 24.1453 | 24.2362 |
| Pivot points | S3 | S2 | S1 | PP | R1 | R2 | R3 |
|---|---|---|---|---|---|---|---|
| Standard | 23.4006 | 23.7356 | 24.0358 | 24.3708 | 24.6710 | 25.0060 | 25.3062 |
| Camarilla | 24.1612 | 24.2195 | 24.2777 | 24.3359 | 24.3941 | 24.4524 | 24.5106 |
| Woodie | 23.3831 | 23.7269 | 24.0183 | 24.3621 | 24.6535 | 24.9973 | 25.2887 |
| Fibonacci | 23.7356 | 23.9783 | 24.1282 | 24.3708 | 24.6135 | 24.7634 | 25.0060 |
| Pivot points | S3 | S2 | S1 | PP | R1 | R2 | R3 |
|---|---|---|---|---|---|---|---|
| Standard | 22.8890 | 23.3597 | 23.8202 | 24.2909 | 24.7514 | 25.2221 | 25.6826 |
| Camarilla | 24.0246 | 24.1100 | 24.1953 | 24.2807 | 24.3661 | 24.4514 | 24.5368 |
| Woodie | 22.8839 | 23.3572 | 23.8151 | 24.2884 | 24.7463 | 25.2196 | 25.6775 |
| Fibonacci | 23.3597 | 23.7154 | 23.9352 | 24.2909 | 24.6466 | 24.8664 | 25.2221 |
Numerical data
The following is the status of the technical indicators and moving averages at the time of publication of this technical analysis:
| RSI (14): | 50.94 | |
| MACD (12,26,9): | 0.2798 | |
| Directional Movement: | 10.6691 | |
| AROON (14): | 71.4286 | |
| DEMA (21): | 24.2616 | |
| Parabolic SAR (0,02-0,02-0,2): | 24.7059 | |
| Elder Ray (13): | 0.0785 | |
| Super Trend (3,10): | 23.2573 | |
| Zig ZAG (10): | 23.8235 | |
| VORTEX (21): | 1.1348 | |
| Stochastique (14,3,5): | 55.67 | |
| TEMA (21): | 24.3712 | |
| Williams %R (14): | -76.85 | |
| Chande Momentum Oscillator (20): | -0.5130 | |
| Repulse (5,40,3): | -3.6188 | |
| ROCnROLL: | -1 | |
| TRIX (15,9): | 0.1852 | |
| Courbe Coppock: | 6.49 |
| MA7: | 24.1355 | |
| MA20: | 24.1502 | |
| MA50: | 24.1733 | |
| MA100: | 23.8266 | |
| MAexp7: | 24.1308 | |
| MAexp20: | 23.8926 | |
| MAexp50: | 23.4864 | |
| MAexp100: | 23.1975 | |
| Price / MA7: | -1.30% | |
| Price / MA20: | -1.36% | |
| Price / MA50: | -1.45% | |
| Price / MA100: | -0.02% | |
| Price / MAexp7: | -1.28% | |
| Price / MAexp20: | -0.30% | |
| Price / MAexp50: | +1.43% | |
| Price / MAexp100: | +2.69% |
About author

Online


Add a comment
Comments
0 comments on the analysis USD/CZK - Weekly