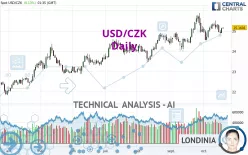
USD/CZK - Daily - Technical analysis published on 10/20/2022 (GMT)
- 148
- 0
Click here for a new analysis!
- Timeframe : Daily
- - Analysis generated on
- Status : INVALID

Summary of the analysis

Additional analysis
Quotes
The USD/CZK price is 25.1632 CZK. The price has increased by +0.15% since the last closing with the lowest point at 25.1134 CZK and the highest point at 25.1713 CZK. The deviation from the price is +0.20% for the low point and -0.03% for the high point.A bullish opening was detected by the Central Gaps scanner. Buyers are trying to impose a bullish momentum in the very short term.
Bullish opening
Type : Bullish
Timeframe : Openning
A study of price movements over other periods shows the following variations:
Near a new HIGH record (5 years)
Type : Bullish
Timeframe : Weekly
Near a new HIGH record (1 year)
Type : Bullish
Timeframe : Weekly
Near a new HIGH record (1st january)
Type : Bullish
Timeframe : Weekly
Near a new HIGH record (1 month)
Type : Bullish
Timeframe : Weekly
Technical
Technical analysis of USD/CZK in Daily shows a strongly overall bullish trend. 92.86% of the signals given by moving averages are bullish. This strongly bullish trend is supported by the strong bullish signals given by short-term moving averages. The Central Indicators scanner detects bullish signals on moving averages that could impact this trend:
Bullish trend reversal : adaptative moving average 20
Type : Bullish
Timeframe : Daily
Bullish price crossover with Moving Average 20
Type : Bullish
Timeframe : Daily
In fact, only 9 technical indicators out of 18 studied are currently bullish. The Central Indicators scanner found no further results concerning independent technical indicators.
The analysis of the price chart with Central Patterns scanners does not return any result.
The Central Candlesticks scanner which studies Japanese candlesticks did not detect anything.
| S3 | S2 | S1 | Price | R1 | R2 | |
|---|---|---|---|---|---|---|
| ProTrendLines | 22.9378 | 23.4329 | 24.4839 | 25.1632 | 25.6095 | 26.0304 |
| Change (%) | -8.84% | -6.88% | -2.70% | - | +1.77% | +3.45% |
| Change | -2.2254 | -1.7303 | -0.6793 | - | +0.4463 | +0.8672 |
| Level | Intermediate | Major | Major | - | Major | Major |
Attention could also be paid to pivot points to set price objectives:
| Pivot points | S3 | S2 | S1 | PP | R1 | R2 | R3 |
|---|---|---|---|---|---|---|---|
| Standard | 24.6804 | 24.7842 | 24.9555 | 25.0593 | 25.2306 | 25.3344 | 25.5057 |
| Camarilla | 25.0512 | 25.0764 | 25.1016 | 25.1268 | 25.1520 | 25.1772 | 25.2025 |
| Woodie | 24.7142 | 24.8011 | 24.9893 | 25.0762 | 25.2644 | 25.3513 | 25.5395 |
| Fibonacci | 24.7842 | 24.8893 | 24.9542 | 25.0593 | 25.1644 | 25.2293 | 25.3344 |
| Pivot points | S3 | S2 | S1 | PP | R1 | R2 | R3 |
|---|---|---|---|---|---|---|---|
| Standard | 24.6477 | 24.8631 | 25.0820 | 25.2974 | 25.5163 | 25.7317 | 25.9506 |
| Camarilla | 25.1815 | 25.2213 | 25.2611 | 25.3009 | 25.3407 | 25.3805 | 25.4203 |
| Woodie | 24.6495 | 24.8640 | 25.0838 | 25.2983 | 25.5181 | 25.7326 | 25.9524 |
| Fibonacci | 24.8631 | 25.0290 | 25.1315 | 25.2974 | 25.4633 | 25.5658 | 25.7317 |
| Pivot points | S3 | S2 | S1 | PP | R1 | R2 | R3 |
|---|---|---|---|---|---|---|---|
| Standard | 22.3483 | 23.2160 | 24.1479 | 25.0156 | 25.9475 | 26.8152 | 27.7471 |
| Camarilla | 24.5849 | 24.7499 | 24.9148 | 25.0798 | 25.2448 | 25.4097 | 25.5747 |
| Woodie | 22.3804 | 23.2321 | 24.1800 | 25.0317 | 25.9796 | 26.8313 | 27.7792 |
| Fibonacci | 23.2160 | 23.9035 | 24.3282 | 25.0156 | 25.7031 | 26.1278 | 26.8152 |
Numerical data
The following are the details of the technical indicators and moving averages that were collected to generate this technical analysis:
| RSI (14): | 53.85 | |
| MACD (12,26,9): | 0.0949 | |
| Directional Movement: | 0.8893 | |
| AROON (14): | 50.0000 | |
| DEMA (21): | 25.2005 | |
| Parabolic SAR (0,02-0,02-0,2): | 25.5932 | |
| Elder Ray (13): | 0.0411 | |
| Super Trend (3,10): | 25.8607 | |
| Zig ZAG (10): | 25.1585 | |
| VORTEX (21): | 1.0609 | |
| Stochastique (14,3,5): | 52.77 | |
| TEMA (21): | 25.1532 | |
| Williams %R (14): | -36.31 | |
| Chande Momentum Oscillator (20): | 0.5825 | |
| Repulse (5,40,3): | 0.3179 | |
| ROCnROLL: | 1 | |
| TRIX (15,9): | 0.0736 | |
| Courbe Coppock: | 0.03 |
| MA7: | 25.1353 | |
| MA20: | 25.1535 | |
| MA50: | 24.7857 | |
| MA100: | 24.3099 | |
| MAexp7: | 25.1125 | |
| MAexp20: | 25.0536 | |
| MAexp50: | 24.7867 | |
| MAexp100: | 24.3509 | |
| Price / MA7: | +0.11% | |
| Price / MA20: | +0.04% | |
| Price / MA50: | +1.52% | |
| Price / MA100: | +3.51% | |
| Price / MAexp7: | +0.20% | |
| Price / MAexp20: | +0.43% | |
| Price / MAexp50: | +1.51% | |
| Price / MAexp100: | +3.33% |
About author
Online


Add a comment
Comments
0 comments on the analysis USD/CZK - Daily