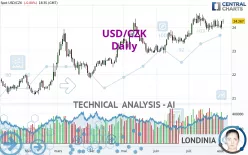
USD/CZK - Daily - Technical analysis published on 08/03/2022 (GMT)
- 192
- 0
Click here for a new analysis!
- Timeframe : Daily
- - Analysis generated on
- Status : INVALID

Summary of the analysis

Additional analysis
Quotes
The USD/CZK rating is 24.2670 CZK. The price has increased by +0.00% since the last closing and was traded between 24.1479 CZK and 24.3592 CZK over the period. The price is currently at +0.49% from its lowest and -0.38% from its highest.The Central Gaps scanner detects a bearish opening. A small advantage for sellers in the very short term.
Bearish opening
Type : Bearish
Timeframe : Openning
So that you have an overall view of the price change, here is a table showing the variations over several periods:
Near a new HIGH record (1 year)
Type : Bullish
Timeframe : Weekly
Near a new HIGH record (1st january)
Type : Bullish
Timeframe : Weekly
Near a new LOW record (1 month)
Type : Bearish
Timeframe : Weekly
Technical
Technical analysis of this Daily chart of USD/CZK indicates that the overall trend is strongly bullish. 89.29% of the signals given by moving averages are bullish. The slightly bullish signals given by the short-term moving averages show a weakening of the global trend. The Central Indicators market scanner currently does not detect any result that concerns moving averages.
The probability of a further increase are moderate given the direction of the technical indicators.
Other results related to technical indicators were also found by the Central Indicators scanner:
Parabolic SAR indicator bullish reversal
Type : Bullish
Timeframe : Daily
Price is back over the pivot point
Type : Bullish
Timeframe : Weekly
Momentum indicator is back over 0
Type : Bullish
Timeframe : Daily
The Central Patterns scanner, which studies chart patterns, resistances and supports, has identified this signal:
Near support of channel
Type : Bullish
Timeframe : Daily
Central Candlesticks, the scanner specialised in Japanese candlesticks, detects these signals that could have an impact on the current short-term trend:
Bearish harami
Type : Bearish
Timeframe : Daily
Doji
Type : Neutral
Timeframe : Daily
| S3 | S2 | S1 | Price | R1 | R2 | R3 | |
|---|---|---|---|---|---|---|---|
| ProTrendLines | 23.4329 | 23.7308 | 24.1696 | 24.2670 | 24.4900 | 25.6095 | 26.0304 |
| Change (%) | -3.44% | -2.21% | -0.40% | - | +0.92% | +5.53% | +7.27% |
| Change | -0.8341 | -0.5362 | -0.0974 | - | +0.2230 | +1.3425 | +1.7634 |
| Level | Major | Intermediate | Major | - | Intermediate | Minor | Major |
Attention could also be paid to pivot points to set price objectives:
| Pivot points | S3 | S2 | S1 | PP | R1 | R2 | R3 |
|---|---|---|---|---|---|---|---|
| Standard | 23.6866 | 23.8055 | 24.0364 | 24.1553 | 24.3862 | 24.5051 | 24.7360 |
| Camarilla | 24.1712 | 24.2033 | 24.2353 | 24.2674 | 24.2995 | 24.3315 | 24.3636 |
| Woodie | 23.7427 | 23.8335 | 24.0925 | 24.1833 | 24.4423 | 24.5331 | 24.7921 |
| Fibonacci | 23.8055 | 23.9391 | 24.0216 | 24.1553 | 24.2889 | 24.3714 | 24.5051 |
| Pivot points | S3 | S2 | S1 | PP | R1 | R2 | R3 |
|---|---|---|---|---|---|---|---|
| Standard | 23.4539 | 23.6810 | 23.8822 | 24.1093 | 24.3105 | 24.5376 | 24.7388 |
| Camarilla | 23.9655 | 24.0048 | 24.0440 | 24.0833 | 24.1226 | 24.1618 | 24.2011 |
| Woodie | 23.4409 | 23.6745 | 23.8692 | 24.1028 | 24.2975 | 24.5311 | 24.7258 |
| Fibonacci | 23.6810 | 23.8446 | 23.9457 | 24.1093 | 24.2729 | 24.3740 | 24.5376 |
| Pivot points | S3 | S2 | S1 | PP | R1 | R2 | R3 |
|---|---|---|---|---|---|---|---|
| Standard | 22.5898 | 23.0986 | 23.5910 | 24.0998 | 24.5922 | 25.1010 | 25.5934 |
| Camarilla | 23.8080 | 23.8998 | 23.9915 | 24.0833 | 24.1751 | 24.2669 | 24.3586 |
| Woodie | 22.5815 | 23.0945 | 23.5827 | 24.0957 | 24.5839 | 25.0969 | 25.5851 |
| Fibonacci | 23.0986 | 23.4811 | 23.7174 | 24.0998 | 24.4823 | 24.7186 | 25.1010 |
Numerical data
The following are the details of the technical indicators and moving averages that were collected to generate this technical analysis:
| RSI (14): | 57.51 | |
| MACD (12,26,9): | 0.1039 | |
| Directional Movement: | 10.9652 | |
| AROON (14): | -28.5714 | |
| DEMA (21): | 24.2467 | |
| Parabolic SAR (0,02-0,02-0,2): | 23.8180 | |
| Elder Ray (13): | 0.1178 | |
| Super Trend (3,10): | 23.5769 | |
| Zig ZAG (10): | 24.2700 | |
| VORTEX (21): | 1.0749 | |
| Stochastique (14,3,5): | 53.00 | |
| TEMA (21): | 24.1972 | |
| Williams %R (14): | -29.88 | |
| Chande Momentum Oscillator (20): | 0.0803 | |
| Repulse (5,40,3): | 0.7654 | |
| ROCnROLL: | 1 | |
| TRIX (15,9): | 0.0801 | |
| Courbe Coppock: | 1.04 |
| MA7: | 24.1524 | |
| MA20: | 24.1893 | |
| MA50: | 23.7307 | |
| MA100: | 23.3011 | |
| MAexp7: | 24.1632 | |
| MAexp20: | 24.0884 | |
| MAexp50: | 23.8104 | |
| MAexp100: | 23.4037 | |
| Price / MA7: | +0.47% | |
| Price / MA20: | +0.32% | |
| Price / MA50: | +2.26% | |
| Price / MA100: | +4.15% | |
| Price / MAexp7: | +0.43% | |
| Price / MAexp20: | +0.74% | |
| Price / MAexp50: | +1.92% | |
| Price / MAexp100: | +3.69% |
About author
Online


Add a comment
Comments
0 comments on the analysis USD/CZK - Daily