| Open: | 4.865 |
| Change: | -0.185 |
| Volume: | 62 |
| Low: | 4.390 |
| High: | 4.895 |
| High / Low range: | 0.505 |
| Type: | Forex |
| Ticker: | USDCHF |
| ISIN: |
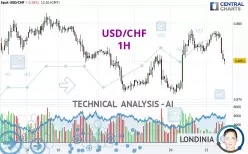
USD/CHF - 1H - Technical analysis published on 03/21/2025 (GMT)
- 131
- 0
- 03/21/2025 - 12:16
Click here for a new analysis!
- Timeframe : 1H
- - Analysis generated on 03/21/2025 - 12:16
- Status : INVALID

Summary of the analysis

Additional analysis
Quotes
The USD/CHF rating is 0.8801 CHF. The price is lower by -0.18% since the last closing and was traded between 0.8796 CHF and 0.8840 CHF over the period. The price is currently at +0.06% from its lowest and -0.44% from its highest.Here is a more detailed summary of the historical variations registered by USD/CHF:
Near a new LOW record (5 years)
Type : Bearish
Timeframe : Weekly
Near a new LOW record (1 year)
Type : Bearish
Timeframe : Weekly
Near a new HIGH record (1st january)
Type : Bullish
Timeframe : Weekly
Near a new HIGH record (1 month)
Type : Bullish
Timeframe : Weekly
Technical
A technical analysis in 1H of this USD/CHF chart shows a neutral trend. The trend could quickly turn bearish due to the strong bearish signals currently being given by short-term moving averages. The Central Indicators scanner detects a bearish signal on moving averages that could impact this trend:
Bearish trend reversal : adaptative moving average 100
Type : Bearish
Timeframe : 1 hour
An assessment of technical indicators does not currently provide any relevant information to suggest whether the signal given by the technical indicators is more bullish or bearish.
Caution: the Central Indicators scanner currently detects an excess:
CCI indicator is oversold : under -100
Type : Neutral
Timeframe : 1 hour
Williams %R indicator is oversold : under -80
Type : Neutral
Timeframe : 1 hour
SuperTrend indicator bearish reversal
Type : Bearish
Timeframe : 1 hour
Price is back under the pivot point (Daily)
Type : Bearish
Timeframe : 1 hour
Price is back under the pivot point (Daily)
Type : Bearish
Timeframe : Weekly
The Central Patterns scanner, which studies chart patterns, resistances and supports, has identified these signals:
Near horizontal support
Type : Bullish
Timeframe : 1 hour
Support of channel is broken
Type : Bearish
Timeframe : 1 hour
No result was found by the Central Candlesticks scanner on Japanese candlesticks.
| S3 | S2 | S1 | Price | R1 | R2 | R3 | |
|---|---|---|---|---|---|---|---|
| ProTrendLines | 0.8759 | 0.8776 | 0.8787 | 0.8801 | 0.8809 | 0.8826 | 0.8836 |
| Change (%) | -0.48% | -0.28% | -0.16% | - | +0.09% | +0.28% | +0.40% |
| Change | -0.0042 | -0.0025 | -0.0014 | - | +0.0008 | +0.0025 | +0.0035 |
| Level | Major | Minor | Minor | - | Intermediate | Minor | Major |
To determine price objectives, it is also possible to use the pivot points. Here is the price position in relation to pivot points:
| Pivot points | S3 | S2 | S1 | PP | R1 | R2 | R3 |
|---|---|---|---|---|---|---|---|
| Standard | 0.8681 | 0.8718 | 0.8768 | 0.8805 | 0.8855 | 0.8892 | 0.8942 |
| Camarilla | 0.8793 | 0.8801 | 0.8809 | 0.8817 | 0.8825 | 0.8833 | 0.8841 |
| Woodie | 0.8687 | 0.8721 | 0.8774 | 0.8808 | 0.8861 | 0.8895 | 0.8948 |
| Fibonacci | 0.8718 | 0.8752 | 0.8772 | 0.8805 | 0.8839 | 0.8859 | 0.8892 |
| Pivot points | S3 | S2 | S1 | PP | R1 | R2 | R3 |
|---|---|---|---|---|---|---|---|
| Standard | 0.8682 | 0.8720 | 0.8788 | 0.8826 | 0.8894 | 0.8932 | 0.9000 |
| Camarilla | 0.8827 | 0.8837 | 0.8846 | 0.8856 | 0.8866 | 0.8875 | 0.8885 |
| Woodie | 0.8697 | 0.8728 | 0.8803 | 0.8834 | 0.8909 | 0.8940 | 0.9015 |
| Fibonacci | 0.8720 | 0.8761 | 0.8786 | 0.8826 | 0.8867 | 0.8892 | 0.8932 |
| Pivot points | S3 | S2 | S1 | PP | R1 | R2 | R3 |
|---|---|---|---|---|---|---|---|
| Standard | 0.8610 | 0.8761 | 0.8895 | 0.9046 | 0.9180 | 0.9331 | 0.9465 |
| Camarilla | 0.8951 | 0.8977 | 0.9003 | 0.9029 | 0.9055 | 0.9081 | 0.9107 |
| Woodie | 0.8602 | 0.8757 | 0.8887 | 0.9042 | 0.9172 | 0.9327 | 0.9457 |
| Fibonacci | 0.8761 | 0.8870 | 0.8937 | 0.9046 | 0.9155 | 0.9222 | 0.9331 |
Numerical data
The following is the status of the technical indicators and moving averages at the time of publication of this technical analysis:
| RSI (14): | 43.35 | |
| MACD (12,26,9): | 0.0008 | |
| Directional Movement: | -3.1450 | |
| AROON (14): | -35.7143 | |
| DEMA (21): | 0.8830 | |
| Parabolic SAR (0,02-0,02-0,2): | 0.8813 | |
| Elder Ray (13): | -0.0004 | |
| Super Trend (3,10): | 0.8808 | |
| Zig ZAG (10): | 0.8818 | |
| VORTEX (21): | 0.9563 | |
| Stochastique (14,3,5): | 61.11 | |
| TEMA (21): | 0.8835 | |
| Williams %R (14): | -73.33 | |
| Chande Momentum Oscillator (20): | 0.0002 | |
| Repulse (5,40,3): | -0.2129 | |
| ROCnROLL: | -1 | |
| TRIX (15,9): | 0.0158 | |
| Courbe Coppock: | 0.22 |
| MA7: | 0.8808 | |
| MA20: | 0.8870 | |
| MA50: | 0.8991 | |
| MA100: | 0.8943 | |
| MAexp7: | 0.8823 | |
| MAexp20: | 0.8822 | |
| MAexp50: | 0.8811 | |
| MAexp100: | 0.8807 | |
| Price / MA7: | -0.08% | |
| Price / MA20: | -0.78% | |
| Price / MA50: | -2.11% | |
| Price / MA100: | -1.59% | |
| Price / MAexp7: | -0.25% | |
| Price / MAexp20: | -0.24% | |
| Price / MAexp50: | -0.11% | |
| Price / MAexp100: | -0.07% |
News
The last news published on USD/CHF at the time of the generation of this analysis was as follows:
-
03/10/2025 - 16:20
 USD/CHF Analysis: Can the US Dollar Jump Against the Franc?
-
03/05/2025 - 17:31
USD/CHF Analysis: Dollar Hanging on Against the Franc
-
03/04/2025 - 17:19
USD/CHF Analysis: Can the Dollar Bottom Here?
-
02/14/2025 - 16:25
USD/CHF Analysis: Can the USD Turn Things Around?
-
02/13/2025 - 19:04
USD/CHF Analysis: Franc Comes Roaring Back
About author

Online


Add a comment
Comments
0 comments on the analysis USD/CHF - 1H