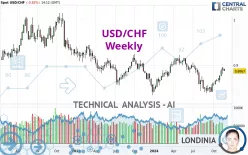
USD/CHF - Weekly - Technical analysis published on 11/25/2024 (GMT)
- 183
- 0
- Timeframe : Weekly
- - Analysis generated on
- Status : NEUTRAL

Summary of the analysis

Additional analysis
Quotes
The USD/CHF price is 0.8868 CHF. The price is up +0.40% over 5 days with the lowest point at 0.8821 CHF and the highest point at 0.8958 CHF. The deviation from the price is +0.53% for the low point and -1.00% for the high point.The Central Gaps scanner detects a bearish opening marking the presence of sellers ahead of buyers at the opening but not sufficiently marked to allow the price to register a quotation gap.
Bearish opening
Type : Bearish
Timeframe : Openning
Here is a more detailed summary of the historical variations registered by USD/CHF:
Near a new HIGH record (1 year)
Type : Bullish
Timeframe : Weekly
Near a new HIGH record (1st january)
Type : Bullish
Timeframe : Weekly
Near a new LOW record (1 month)
Type : Bearish
Timeframe : Weekly
Technical
Technical analysis of USD/CHF in Weekly shows an overall slightly bearish trend. Only 53.57% of the signals given by moving averages are bearish. This slightly bearish trend could turn neutral or reverse given the slightly bullish signals currently being given by short-term moving averages. The Central Indicators scanner detects bearish signals on moving averages that could impact this trend:
Bearish price crossover with Moving Average 100
Type : Bearish
Timeframe : Weekly
Bearish price crossover with adaptative moving average 100
Type : Bearish
Timeframe : Weekly
In fact, according to the parameters integrated into the Central Analyzer system, 16 technical indicators out of 18 analysed are currently bullish. But beware of excesses. The Central Indicators scanner currently detects this:
CCI indicator is overbought : over 100
Type : Neutral
Timeframe : Weekly
Williams %R indicator is overbought : over -20
Type : Neutral
Timeframe : Weekly
MACD indicator is back over 0
Type : Bullish
Timeframe : Weekly
Price is back under the pivot point
Type : Bearish
Timeframe : Weekly
An analysis of the price chart with the Central Patterns scanner (detector of chart patterns and resistances and supports) shows several results that can have an impact on the price change:
Near horizontal resistance
Type : Bearish
Timeframe : Weekly
Near resistance of triangle
Type : Bearish
Timeframe : Weekly
Resistance of channel is broken
Type : Bullish
Timeframe : Weekly
The Central Candlesticks scanner, specialised in Japanese candlesticks, did not identify any signals.
| S3 | S2 | S1 | Price | R1 | R2 | R3 | |
|---|---|---|---|---|---|---|---|
| ProTrendLines | 0.8412 | 0.8547 | 0.8836 | 0.8868 | 0.9210 | 0.9418 | 1.0185 |
| Change (%) | -5.14% | -3.62% | -0.36% | - | +3.86% | +6.20% | +14.85% |
| Change | -0.0456 | -0.0321 | -0.0032 | - | +0.0342 | +0.0550 | +0.1317 |
| Level | Major | Major | Intermediate | - | Major | Minor | Major |
Pivot points can also be used to set your price objectives. Here is the price situation in relation to pivot points:
| Pivot points | S3 | S2 | S1 | PP | R1 | R2 | R3 |
|---|---|---|---|---|---|---|---|
| Standard | 0.8768 | 0.8810 | 0.8875 | 0.8917 | 0.8982 | 0.9024 | 0.9089 |
| Camarilla | 0.8912 | 0.8921 | 0.8931 | 0.8941 | 0.8951 | 0.8961 | 0.8970 |
| Woodie | 0.8781 | 0.8816 | 0.8888 | 0.8923 | 0.8995 | 0.9030 | 0.9102 |
| Fibonacci | 0.8810 | 0.8851 | 0.8876 | 0.8917 | 0.8958 | 0.8983 | 0.9024 |
| Pivot points | S3 | S2 | S1 | PP | R1 | R2 | R3 |
|---|---|---|---|---|---|---|---|
| Standard | 0.8685 | 0.8743 | 0.8842 | 0.8900 | 0.8999 | 0.9057 | 0.9156 |
| Camarilla | 0.8898 | 0.8912 | 0.8927 | 0.8941 | 0.8955 | 0.8970 | 0.8984 |
| Woodie | 0.8706 | 0.8753 | 0.8863 | 0.8910 | 0.9020 | 0.9067 | 0.9177 |
| Fibonacci | 0.8743 | 0.8803 | 0.8840 | 0.8900 | 0.8960 | 0.8997 | 0.9057 |
| Pivot points | S3 | S2 | S1 | PP | R1 | R2 | R3 |
|---|---|---|---|---|---|---|---|
| Standard | 0.8209 | 0.8320 | 0.8478 | 0.8589 | 0.8747 | 0.8858 | 0.9016 |
| Camarilla | 0.8562 | 0.8587 | 0.8611 | 0.8636 | 0.8661 | 0.8685 | 0.8710 |
| Woodie | 0.8233 | 0.8332 | 0.8502 | 0.8601 | 0.8771 | 0.8870 | 0.9040 |
| Fibonacci | 0.8320 | 0.8423 | 0.8486 | 0.8589 | 0.8692 | 0.8755 | 0.8858 |
Numerical data
The following are the details of the technical indicators and moving averages that were collected to generate this technical analysis:
| RSI (14): | 57.12 | |
| MACD (12,26,9): | 0.0002 | |
| Directional Movement: | 6.9180 | |
| AROON (14): | 78.5714 | |
| DEMA (21): | 0.8711 | |
| Parabolic SAR (0,02-0,02-0,2): | 0.8619 | |
| Elder Ray (13): | 0.0153 | |
| Super Trend (3,10): | 0.8502 | |
| Zig ZAG (10): | 0.8869 | |
| VORTEX (21): | 0.9628 | |
| Stochastique (14,3,5): | 91.79 | |
| TEMA (21): | 0.8757 | |
| Williams %R (14): | -15.09 | |
| Chande Momentum Oscillator (20): | 0.0436 | |
| Repulse (5,40,3): | 1.8184 | |
| ROCnROLL: | 1 | |
| TRIX (15,9): | -0.0949 | |
| Courbe Coppock: | 3.43 |
| MA7: | 0.8865 | |
| MA20: | 0.8781 | |
| MA50: | 0.8647 | |
| MA100: | 0.8653 | |
| MAexp7: | 0.8794 | |
| MAexp20: | 0.8734 | |
| MAexp50: | 0.8796 | |
| MAexp100: | 0.8913 | |
| Price / MA7: | +0.03% | |
| Price / MA20: | +0.99% | |
| Price / MA50: | +2.56% | |
| Price / MA100: | +2.48% | |
| Price / MAexp7: | +0.84% | |
| Price / MAexp20: | +1.53% | |
| Price / MAexp50: | +0.82% | |
| Price / MAexp100: | -0.50% |
News
Don't forget to follow the news on USD/CHF. At the time of publication of this analysis, the latest news was as follows:
-
 USD/CHF Forecast November 25, 2024
-
USD/CHF Forecast November 20, 2024
-
USD/CHF Forecast November 19, 2024
-
USD/CHF Forecast November 15, 2024
-
USD/CHF Forecast November 11, 2024
About author

Online


Add a comment
Comments
0 comments on the analysis USD/CHF - Weekly