| Open: | - |
| Change: | - |
| Volume: | - |
| Low: | - |
| High: | - |
| High / Low range: | - |
| Type: | Forex |
| Ticker: | USDCHF |
| ISIN: |
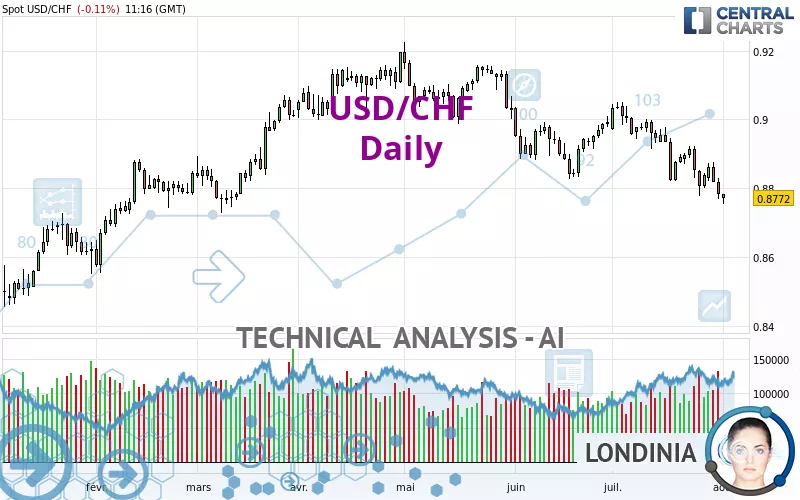
USD/CHF - Daily - Technical analysis published on 08/01/2024 (GMT)
- 164
- 0
- 08/01/2024 - 11:16
Click here for a new analysis!
- Timeframe : Daily
- - Analysis generated on 08/01/2024 - 11:16
- Status : TARGET REACHED
Summary of the analysis

Additional analysis
Quotes
USD/CHF rating 0.8772 CHF. The price is lower by -0.11% since the last closing and was between 0.8754 CHF and 0.8783 CHF. This implies that the price is at +0.21% from its lowest and at -0.13% from its highest.Here is a more detailed summary of the historical variations registered by USD/CHF:
Near a new LOW record (5 years)
Type : Bearish
Timeframe : Weekly
Near a new LOW record (1 year)
Type : Bearish
Timeframe : Weekly
Near a new LOW record (1st january)
Type : Bearish
Timeframe : Weekly
Near a new HIGH record (1 month)
Type : Bullish
Timeframe : Weekly
New LOW record (1 month)
Type : Bearish
Timeframe : Weekly
Technical
Technical analysis of USD/CHF in Daily shows a overall strongly bearish trend. 92.86% of the signals given by moving averages are bearish. This strongly bearish trend is supported by the strong bearish signals given by short-term moving averages. The Central Indicators market scanner is currently detecting a bearish signal that could impact this trend:
Bearish trend reversal : Moving Average 100
Type : Bearish
Timeframe : Daily
An assessment of technical indicators does not currently provide any relevant information on the direction of future price movements.
Caution: the Central Indicators scanner currently detects an excess:
CCI indicator is oversold : under -100
Type : Neutral
Timeframe : Daily
Williams %R indicator is oversold : under -80
Type : Neutral
Timeframe : Daily
An analysis of the price chart with the Central Patterns scanner (detector of chart patterns and resistances and supports) shows several results that can have an impact on the price change:
Near horizontal support
Type : Bullish
Timeframe : Daily
Support of channel is broken
Type : Bearish
Timeframe : Daily
No result was found by the Central Candlesticks scanner on Japanese candlesticks.
| S3 | S2 | S1 | Price | R1 | R2 | R3 | |
|---|---|---|---|---|---|---|---|
| ProTrendLines | 0.8413 | 0.8547 | 0.8695 | 0.8772 | 0.8837 | 0.8915 | 0.9036 |
| Change (%) | -4.09% | -2.56% | -0.88% | - | +0.74% | +1.63% | +3.01% |
| Change | -0.0359 | -0.0225 | -0.0077 | - | +0.0065 | +0.0143 | +0.0264 |
| Level | Major | Major | Minor | - | Major | Intermediate | Intermediate |
To determine price objectives, it is also possible to use the pivot points. Here is the price position in relation to pivot points:
| Pivot points | S3 | S2 | S1 | PP | R1 | R2 | R3 |
|---|---|---|---|---|---|---|---|
| Standard | 0.8698 | 0.8734 | 0.8758 | 0.8794 | 0.8818 | 0.8854 | 0.8878 |
| Camarilla | 0.8766 | 0.8771 | 0.8777 | 0.8782 | 0.8788 | 0.8793 | 0.8799 |
| Woodie | 0.8692 | 0.8731 | 0.8752 | 0.8791 | 0.8812 | 0.8851 | 0.8872 |
| Fibonacci | 0.8734 | 0.8757 | 0.8771 | 0.8794 | 0.8817 | 0.8831 | 0.8854 |
| Pivot points | S3 | S2 | S1 | PP | R1 | R2 | R3 |
|---|---|---|---|---|---|---|---|
| Standard | 0.8622 | 0.8700 | 0.8769 | 0.8847 | 0.8916 | 0.8994 | 0.9063 |
| Camarilla | 0.8799 | 0.8812 | 0.8826 | 0.8839 | 0.8853 | 0.8866 | 0.8879 |
| Woodie | 0.8619 | 0.8698 | 0.8766 | 0.8845 | 0.8913 | 0.8992 | 0.9060 |
| Fibonacci | 0.8700 | 0.8756 | 0.8791 | 0.8847 | 0.8903 | 0.8938 | 0.8994 |
| Pivot points | S3 | S2 | S1 | PP | R1 | R2 | R3 |
|---|---|---|---|---|---|---|---|
| Standard | 0.8403 | 0.8587 | 0.8684 | 0.8868 | 0.8965 | 0.9149 | 0.9246 |
| Camarilla | 0.8705 | 0.8731 | 0.8756 | 0.8782 | 0.8808 | 0.8834 | 0.8859 |
| Woodie | 0.8361 | 0.8565 | 0.8642 | 0.8846 | 0.8923 | 0.9127 | 0.9204 |
| Fibonacci | 0.8587 | 0.8694 | 0.8760 | 0.8868 | 0.8975 | 0.9041 | 0.9149 |
Numerical data
The following is the status of the technical indicators and moving averages at the time of publication of this technical analysis:
| RSI (14): | 34.22 | |
| MACD (12,26,9): | -0.0046 | |
| Directional Movement: | -21.6084 | |
| AROON (14): | -85.7143 | |
| DEMA (21): | 0.8819 | |
| Parabolic SAR (0,02-0,02-0,2): | 0.8895 | |
| Elder Ray (13): | -0.0081 | |
| Super Trend (3,10): | 0.8925 | |
| Zig ZAG (10): | 0.8769 | |
| VORTEX (21): | 0.7883 | |
| Stochastique (14,3,5): | 10.77 | |
| TEMA (21): | 0.8796 | |
| Williams %R (14): | -92.89 | |
| Chande Momentum Oscillator (20): | -0.0164 | |
| Repulse (5,40,3): | -0.6327 | |
| ROCnROLL: | 2 | |
| TRIX (15,9): | -0.0529 | |
| Courbe Coppock: | 2.95 |
| MA7: | 0.8819 | |
| MA20: | 0.8892 | |
| MA50: | 0.8943 | |
| MA100: | 0.9003 | |
| MAexp7: | 0.8818 | |
| MAexp20: | 0.8874 | |
| MAexp50: | 0.8929 | |
| MAexp100: | 0.8942 | |
| Price / MA7: | -0.53% | |
| Price / MA20: | -1.35% | |
| Price / MA50: | -1.91% | |
| Price / MA100: | -2.57% | |
| Price / MAexp7: | -0.52% | |
| Price / MAexp20: | -1.15% | |
| Price / MAexp50: | -1.76% | |
| Price / MAexp100: | -1.90% |
News
The last news published on USD/CHF at the time of the generation of this analysis was as follows:
-
07/19/2024 - 15:45
 USD/CHF Forecast July 22, 2024
-
07/18/2024 - 08:27
Technical Analysis on USDJPY, USDCHF, OIL
-
07/08/2024 - 17:01
USD/CHF Forecast July 9, 2024
-
07/01/2024 - 16:12
USD/CHF Forecast July 2, 2024
-
06/25/2024 - 15:13
USD/CHF Forecast June 26, 2024
About author

Online


Add a comment
Comments
0 comments on the analysis USD/CHF - Daily