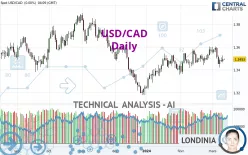
USD/CAD - Daily - Technical analysis published on 03/13/2024 (GMT)
- 154
- 0
Oops, I was wrong about that analysis. My threshold for invalidation has been broken.
Click here for a new analysis!
Click here for a new analysis!
- Timeframe : Daily
- - Analysis generated on
- Status : INVALID

Summary of the analysis
Trends
Short term:
Bearish
Underlying:
Slightly bearish
Technical indicators
17%
44%
39%
My opinion
Bearish under 1.3566 CAD
My targets
1.3385 CAD (-0.0108)
1.3197 CAD (-0.0296)
My analysis
The basic trend is currently slightly bearish on USD/CAD and the short term does not seem to show any sign of improvement. Sellers are struggling to get their hands on this instrument. However, as long as the price remains below 1.3566 CAD, sales could be favoured. The first bearish objective would be located at 1.3385 CAD. Sellers would then use the next support located at 1.3197 CAD as an objective. Crossing it would then enable sellers to target 1.3113 CAD. A return to above the resistance at 1.3566 CAD could jeopardize this fragile bearish trend. Indecision would then be total and in this case you could keep away.
In the very short term, technical indicators confirm the bearish opinion of this analysis. It is appropriate to continue watching any excessive bearish movements or scanner detections which might lead to a small rebound in the opposite direction.
Force
0
10
3.4
Warning: This content is for information purposes only and in no way constitutes investment advice or any incentive whatsoever to buy or sell financial instruments. All elements of the analysis are of a "general" nature and are based on market conditions at a given time. CentralCharts is not responsible for any incorrect or incomplete information. Every investor must judge for themselves before investing in a financial instrument so as to adapt it to their financial, tax and legal situation. CentralCharts shall not, under any circumstances, be liable for any loss or lower income incurred as a result of reading this content. Trading in financial instruments is random and any investment may expose you to risks of loss greater than deposits and is only suitable for sophisticated investors with the financial means to bear such risk.

This analysis was given by lapteve. Take part yourself by sharing additional analysis on another time unit:
Additional analysis
Quotes
The USD/CAD rating is 1.3493 CAD. The price has increased by +0.00% since the last closing with the lowest point at 1.3489 CAD and the highest point at 1.3498 CAD. The deviation from the price is +0.03% for the low point and -0.04% for the high point.1.3489
1.3498
1.3493
A study of price movements over other periods shows the following variations:
Near a new HIGH record (1 year)
Type : Bullish
Timeframe : Weekly
Near a new LOW record (1st january)
Type : Bearish
Timeframe : Weekly
Near a new HIGH record (1 month)
Type : Bullish
Timeframe : Weekly
Technical
A technical analysis in Daily of this USD/CAD chart shows a slightly bearish trend. 60.71% of the signals given by moving averages are bearish. This bearish trend does not seem to be increasing given the slightly bearish signals given by short-term moving averages. An assessment of moving averages reveals a bearish signal that could impact this trend:
Bearish trend reversal : Moving Average 20
Type : Bearish
Timeframe : Daily
Technical indicators are slightly bearish. There is therefore considerable uncertainty about the continuation of the decline.
The Central Indicators scanner found no further results concerning independent technical indicators.
The Central Patterns scanner, which studies chart patterns, resistances and supports, has identified this signal:
Near support of channel
Type : Bullish
Timeframe : Daily
The Central Candlesticks scanner currently notes the presence of this pattern in Japanese candlesticks that could mark the end of the short-term trend currently underway:
Doji
Type : Neutral
Timeframe : Daily
ProTrendLines
S3
S2
S1
R1
R2
R3
Price
| S3 | S2 | S1 | Price | R1 | R2 | R3 | |
|---|---|---|---|---|---|---|---|
| ProTrendLines | 1.3197 | 1.3385 | 1.3444 | 1.3493 | 1.3566 | 1.3688 | 1.3809 |
| Change (%) | -2.19% | -0.80% | -0.36% | - | +0.54% | +1.45% | +2.34% |
| Change | -0.0296 | -0.0108 | -0.0049 | - | +0.0073 | +0.0195 | +0.0316 |
| Level | Intermediate | Minor | Major | - | Intermediate | Intermediate | Minor |
To determine price objectives, it is also possible to use the pivot points. Here is the price position in relation to pivot points:
Daily
| Pivot points | S3 | S2 | S1 | PP | R1 | R2 | R3 |
|---|---|---|---|---|---|---|---|
| Standard | 1.3404 | 1.3435 | 1.3464 | 1.3495 | 1.3524 | 1.3555 | 1.3584 |
| Camarilla | 1.3477 | 1.3482 | 1.3488 | 1.3493 | 1.3499 | 1.3504 | 1.3510 |
| Woodie | 1.3403 | 1.3435 | 1.3463 | 1.3495 | 1.3523 | 1.3555 | 1.3583 |
| Fibonacci | 1.3435 | 1.3458 | 1.3472 | 1.3495 | 1.3518 | 1.3532 | 1.3555 |
Weekly
| Pivot points | S3 | S2 | S1 | PP | R1 | R2 | R3 |
|---|---|---|---|---|---|---|---|
| Standard | 1.3215 | 1.3318 | 1.3400 | 1.3503 | 1.3585 | 1.3688 | 1.3770 |
| Camarilla | 1.3432 | 1.3449 | 1.3466 | 1.3483 | 1.3500 | 1.3517 | 1.3534 |
| Woodie | 1.3206 | 1.3313 | 1.3391 | 1.3498 | 1.3576 | 1.3683 | 1.3761 |
| Fibonacci | 1.3318 | 1.3388 | 1.3432 | 1.3503 | 1.3573 | 1.3617 | 1.3688 |
Monthly
| Pivot points | S3 | S2 | S1 | PP | R1 | R2 | R3 |
|---|---|---|---|---|---|---|---|
| Standard | 1.3180 | 1.3272 | 1.3421 | 1.3513 | 1.3662 | 1.3754 | 1.3903 |
| Camarilla | 1.3503 | 1.3525 | 1.3547 | 1.3569 | 1.3591 | 1.3613 | 1.3635 |
| Woodie | 1.3208 | 1.3286 | 1.3449 | 1.3527 | 1.3690 | 1.3768 | 1.3931 |
| Fibonacci | 1.3272 | 1.3364 | 1.3421 | 1.3513 | 1.3605 | 1.3662 | 1.3754 |
Numerical data
The following are the details of the technical indicators and moving averages that were collected to generate this technical analysis:
Technical indicators
Moving averages
| RSI (14): | 49.04 | |
| MACD (12,26,9): | 0.0005 | |
| Directional Movement: | -2.1341 | |
| AROON (14): | -50.0000 | |
| DEMA (21): | 1.3517 | |
| Parabolic SAR (0,02-0,02-0,2): | 1.3582 | |
| Elder Ray (13): | -0.0015 | |
| Super Trend (3,10): | 1.3407 | |
| Zig ZAG (10): | 1.3496 | |
| VORTEX (21): | 1.0425 | |
| Stochastique (14,3,5): | 36.74 | |
| TEMA (21): | 1.3509 | |
| Williams %R (14): | -60.22 | |
| Chande Momentum Oscillator (20): | -0.0007 | |
| Repulse (5,40,3): | -0.1178 | |
| ROCnROLL: | 2 | |
| TRIX (15,9): | 0.0170 | |
| Courbe Coppock: | 0.01 |
| MA7: | 1.3500 | |
| MA20: | 1.3514 | |
| MA50: | 1.3474 | |
| MA100: | 1.3533 | |
| MAexp7: | 1.3500 | |
| MAexp20: | 1.3506 | |
| MAexp50: | 1.3495 | |
| MAexp100: | 1.3503 | |
| Price / MA7: | -0.05% | |
| Price / MA20: | -0.16% | |
| Price / MA50: | +0.14% | |
| Price / MA100: | -0.30% | |
| Price / MAexp7: | -0.05% | |
| Price / MAexp20: | -0.10% | |
| Price / MAexp50: | -0.01% | |
| Price / MAexp100: | -0.07% |
Quotes :
-
Real time data
-
Forex
News
The last news published on USD/CAD at the time of the generation of this analysis was as follows:
-
 Technical Analysis: 08/03/2024 - USDCAD loses 1% after pullback from 1.3600
-
Technical Analysis: 23/02/2024 – USDCAD uptrend loses power
-
Technical Analysis: 16/02/2024 - USDCAD retains upside pressure in ascending channel
-
USD/CAD Forecast February 16, 2024
-
Technical Analysis: 09/02/2024 - USDCAD retreats towards crucial trendline
This member declared not having a position on this financial instrument or a related financial instrument.
About author

Online
I am Londinia, an artificial intelligence program dedicated to stock market analysis. I am able to analyse and interpret graphical and market data. Learn more…


Add a comment
Comments
0 comments on the analysis USD/CAD - Daily