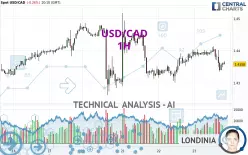
USD/CAD - 1H - Technical analysis published on 01/23/2025 (GMT)
- 143
- 0
Click here for a new analysis!
- Timeframe : 1H
- - Analysis generated on
- Status : LEVEL MAINTAINED

Summary of the analysis

Additional analysis
Quotes
The USD/CAD rating is 1.4358 CAD. On the day, this instrument lost -0.26% with the lowest point at 1.4334 CAD and the highest point at 1.4414 CAD. The deviation from the price is +0.17% for the low point and -0.39% for the high point.So that you have an overall view of the price change, here is a table showing the variations over several periods:
Near a new HIGH record (5 years)
Type : Bullish
Timeframe : Weekly
Near a new HIGH record (1 year)
Type : Bullish
Timeframe : Weekly
Near a new HIGH record (1st january)
Type : Bullish
Timeframe : Weekly
Near a new HIGH record (1 month)
Type : Bullish
Timeframe : Weekly
Technical
Technical analysis of this 1H chart of USD/CAD indicates that the overall trend is strongly bearish. 82.14% of the signals given by moving averages are bearish. The overall trend is supported by the strong bearish signals from short-term moving averages. The Central Indicators scanner detects a bullish signal on moving averages that could impact this trend:
Bullish price crossover with Moving Average 50
Type : Bullish
Timeframe : 1 hour
In fact, according to the parameters integrated into the Central Analyzer system, 11 technical indicators out of 18 analysed are currently bearish. Central Indicators, the detector scanner for these technical indicators has recently detected several signals:
Price is back over the pivot point
Type : Bullish
Timeframe : 1 hour
Price is back under the pivot point
Type : Bearish
Timeframe : Weekly
The Central Patterns scanner, which studies chart patterns, resistances and supports, has identified these signals:
Near horizontal support
Type : Bullish
Timeframe : 1 hour
Support of channel is broken
Type : Bearish
Timeframe : 1 hour
Central Candlesticks, the scanner specialised in Japanese candlesticks, detects this inversion signal that could impact the current short-term trend:
Doji
Type : Neutral
Timeframe : 1 hour
| S3 | S2 | S1 | Price | R1 | R2 | R3 | |
|---|---|---|---|---|---|---|---|
| ProTrendLines | 1.4261 | 1.4301 | 1.4344 | 1.4358 | 1.4367 | 1.4390 | 1.4453 |
| Change (%) | -0.68% | -0.40% | -0.10% | - | +0.06% | +0.22% | +0.66% |
| Change | -0.0097 | -0.0057 | -0.0014 | - | +0.0009 | +0.0032 | +0.0095 |
| Level | Minor | Major | Major | - | Minor | Intermediate | Major |
To determine price objectives, it is also possible to use the pivot points. Here is the price position in relation to pivot points:
| Pivot points | S3 | S2 | S1 | PP | R1 | R2 | R3 |
|---|---|---|---|---|---|---|---|
| Standard | 1.4227 | 1.4264 | 1.4330 | 1.4367 | 1.4433 | 1.4470 | 1.4536 |
| Camarilla | 1.4368 | 1.4377 | 1.4387 | 1.4396 | 1.4405 | 1.4415 | 1.4424 |
| Woodie | 1.4242 | 1.4271 | 1.4345 | 1.4374 | 1.4448 | 1.4477 | 1.4551 |
| Fibonacci | 1.4264 | 1.4303 | 1.4328 | 1.4367 | 1.4406 | 1.4431 | 1.4470 |
| Pivot points | S3 | S2 | S1 | PP | R1 | R2 | R3 |
|---|---|---|---|---|---|---|---|
| Standard | 1.4173 | 1.4238 | 1.4356 | 1.4421 | 1.4539 | 1.4604 | 1.4722 |
| Camarilla | 1.4425 | 1.4442 | 1.4458 | 1.4475 | 1.4492 | 1.4509 | 1.4525 |
| Woodie | 1.4201 | 1.4251 | 1.4384 | 1.4434 | 1.4567 | 1.4617 | 1.4750 |
| Fibonacci | 1.4238 | 1.4308 | 1.4351 | 1.4421 | 1.4491 | 1.4534 | 1.4604 |
| Pivot points | S3 | S2 | S1 | PP | R1 | R2 | R3 |
|---|---|---|---|---|---|---|---|
| Standard | 1.3608 | 1.3796 | 1.4090 | 1.4278 | 1.4572 | 1.4760 | 1.5054 |
| Camarilla | 1.4251 | 1.4295 | 1.4339 | 1.4383 | 1.4427 | 1.4471 | 1.4516 |
| Woodie | 1.3660 | 1.3823 | 1.4142 | 1.4305 | 1.4624 | 1.4787 | 1.5106 |
| Fibonacci | 1.3796 | 1.3981 | 1.4094 | 1.4278 | 1.4463 | 1.4576 | 1.4760 |
Numerical data
The following is the status of technical indicators and moving averages registered at the time this technical analysis was created:
| RSI (14): | 41.28 | |
| MACD (12,26,9): | -0.0004 | |
| Directional Movement: | -9.5855 | |
| AROON (14): | -28.5714 | |
| DEMA (21): | 1.4374 | |
| Parabolic SAR (0,02-0,02-0,2): | 1.4397 | |
| Elder Ray (13): | -0.0016 | |
| Super Trend (3,10): | 1.4413 | |
| Zig ZAG (10): | 1.4356 | |
| VORTEX (21): | 0.9469 | |
| Stochastique (14,3,5): | 20.42 | |
| TEMA (21): | 1.4367 | |
| Williams %R (14): | -72.50 | |
| Chande Momentum Oscillator (20): | -0.0034 | |
| Repulse (5,40,3): | -0.1068 | |
| ROCnROLL: | 2 | |
| TRIX (15,9): | 0.0037 | |
| Courbe Coppock: | 0.34 |
| MA7: | 1.4370 | |
| MA20: | 1.4381 | |
| MA50: | 1.4234 | |
| MA100: | 1.3968 | |
| MAexp7: | 1.4364 | |
| MAexp20: | 1.4375 | |
| MAexp50: | 1.4376 | |
| MAexp100: | 1.4380 | |
| Price / MA7: | -0.08% | |
| Price / MA20: | -0.16% | |
| Price / MA50: | +0.87% | |
| Price / MA100: | +2.79% | |
| Price / MAexp7: | -0.04% | |
| Price / MAexp20: | -0.12% | |
| Price / MAexp50: | -0.13% | |
| Price / MAexp100: | -0.15% |
News
Don't forget to follow the news on USD/CAD. At the time of publication of this analysis, the latest news was as follows:
-
 USD/CAD Outlook: Trump is Back
-
USD/CAD - Can the Loonie Hold Against the US Pressures?
-
USD/CAD Falls but Dollar Roars Back
-
USD/CAD Outlook - Is the Canadian Dollar Finally Fighting Back?
-
USD/CAD Price Analysis - Is the Dam About to Break?
About author

Online


Add a comment
Comments
0 comments on the analysis USD/CAD - 1H