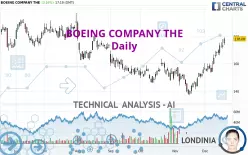
BOEING COMPANY THE - Daily - Technical analysis published on 12/19/2024 (GMT)
- 119
- 0
Click here for a new analysis!
- Timeframe : Daily
- - Analysis generated on
- Status : INVALID

Summary of the analysis

Additional analysis
Quotes
The BOEING COMPANY THE rating is 178.10 USD. On the day, this instrument gained +3.18% and was traded between 173.72 USD and 179.20 USD over the period. The price is currently at +2.52% from its lowest and -0.61% from its highest.The Central Gaps scanner detects a bullish opening marking the presence of buyers ahead of sellers at the opening but not sufficiently marked to allow the price to register a quotation gap.
Bullish opening
Type : Bullish
Timeframe : Openning
So that you have an overall view of the price change, here is a table showing the variations over several periods:
New HIGH record (1 month)
Type : Bullish
Timeframe : Weekly
Technical
Technical analysis of this Daily chart of BOEING COMPANY THE indicates that the overall trend is bullish. The signals returned by the moving averages are 75.00% bullish. This bullish trend is reinforced by the strong signals currently being given by short-term moving averages. There is no crossing of moving average by the price or crossing of moving averages between themselves.
In fact, 16 technical indicators on 18 studied are currently bullish. Caution: the Central Indicators scanner currently detects an excess:
RSI indicator is overbought : over 70
Type : Neutral
Timeframe : Daily
CCI indicator is overbought : over 100
Type : Neutral
Timeframe : Daily
Williams %R indicator is overbought : over -20
Type : Neutral
Timeframe : Daily
Pivot points : price is over resistance 1
Type : Neutral
Timeframe : Daily
Pivot points : price is over resistance 1
Type : Neutral
Timeframe : Weekly
Central Patterns, the market scanner focusing on chart patterns, resistances and supports found these results:
Horizontal resistance is broken
Type : Bullish
Timeframe : Daily
Resistance of channel is broken
Type : Bullish
Timeframe : Daily
No result was found by the Central Candlesticks scanner on Japanese candlesticks.
| S3 | S2 | S1 | Price | R1 | R2 | R3 | |
|---|---|---|---|---|---|---|---|
| ProTrendLines | 146.73 | 164.21 | 175.00 | 178.10 | 179.92 | 191.01 | 207.18 |
| Change (%) | -17.61% | -7.80% | -1.74% | - | +1.02% | +7.25% | +16.33% |
| Change | -31.37 | -13.89 | -3.10 | - | +1.82 | +12.91 | +29.08 |
| Level | Minor | Major | Major | - | Intermediate | Major | Intermediate |
Attention could also be paid to pivot points to set price objectives:
| Pivot points | S3 | S2 | S1 | PP | R1 | R2 | R3 |
|---|---|---|---|---|---|---|---|
| Standard | 162.83 | 166.91 | 169.77 | 173.85 | 176.71 | 180.79 | 183.65 |
| Camarilla | 170.71 | 171.35 | 171.98 | 172.62 | 173.26 | 173.89 | 174.53 |
| Woodie | 162.21 | 166.61 | 169.15 | 173.55 | 176.09 | 180.49 | 183.03 |
| Fibonacci | 166.91 | 169.56 | 171.20 | 173.85 | 176.50 | 178.14 | 180.79 |
| Pivot points | S3 | S2 | S1 | PP | R1 | R2 | R3 |
|---|---|---|---|---|---|---|---|
| Standard | 142.98 | 148.62 | 159.14 | 164.78 | 175.30 | 180.94 | 191.46 |
| Camarilla | 165.21 | 166.69 | 168.17 | 169.65 | 171.13 | 172.61 | 174.09 |
| Woodie | 145.41 | 149.84 | 161.57 | 166.00 | 177.73 | 182.16 | 193.89 |
| Fibonacci | 148.62 | 154.80 | 158.61 | 164.78 | 170.96 | 174.77 | 180.94 |
| Pivot points | S3 | S2 | S1 | PP | R1 | R2 | R3 |
|---|---|---|---|---|---|---|---|
| Standard | 121.89 | 129.46 | 142.52 | 150.09 | 163.15 | 170.72 | 183.78 |
| Camarilla | 149.91 | 151.80 | 153.69 | 155.58 | 157.47 | 159.36 | 161.25 |
| Woodie | 124.64 | 130.83 | 145.27 | 151.46 | 165.90 | 172.09 | 186.53 |
| Fibonacci | 129.46 | 137.34 | 142.21 | 150.09 | 157.97 | 162.84 | 170.72 |
Numerical data
The following are the details of the technical indicators and moving averages that were collected to generate this technical analysis:
| RSI (14): | 75.42 | |
| MACD (12,26,9): | 6.3300 | |
| Directional Movement: | 21.39 | |
| AROON (14): | 100.00 | |
| DEMA (21): | 170.23 | |
| Parabolic SAR (0,02-0,02-0,2): | 166.79 | |
| Elder Ray (13): | 9.83 | |
| Super Trend (3,10): | 159.68 | |
| Zig ZAG (10): | 178.15 | |
| VORTEX (21): | 1.2300 | |
| Stochastique (14,3,5): | 88.08 | |
| TEMA (21): | 175.47 | |
| Williams %R (14): | -3.19 | |
| Chande Momentum Oscillator (20): | 23.48 | |
| Repulse (5,40,3): | 2.9000 | |
| ROCnROLL: | 1 | |
| TRIX (15,9): | 0.4000 | |
| Courbe Coppock: | 24.85 |
| MA7: | 171.54 | |
| MA20: | 160.34 | |
| MA50: | 154.47 | |
| MA100: | 159.11 | |
| MAexp7: | 171.38 | |
| MAexp20: | 162.97 | |
| MAexp50: | 158.31 | |
| MAexp100: | 161.70 | |
| Price / MA7: | +3.82% | |
| Price / MA20: | +11.08% | |
| Price / MA50: | +15.30% | |
| Price / MA100: | +11.94% | |
| Price / MAexp7: | +3.92% | |
| Price / MAexp20: | +9.28% | |
| Price / MAexp50: | +12.50% | |
| Price / MAexp100: | +10.14% |
News
Don't forget to follow the news on BOEING COMPANY THE. At the time of publication of this analysis, the latest news was as follows:
- TRIUMPH POSTPONES SECOND QUARTER FISCAL 2025 RESULTS AND INVESTOR CONFERENCE CALL TO REFLECT INTERIORS PRICE AGREEMENT WITH BOEING COMMERCIAL AIRPLANES
- Boeing Announces Pricing of Upsized Concurrent Offerings of Common Stock and Depositary Shares
- Boeing Announces Launch of Concurrent Offerings of Common Stock and Depositary Shares
-
 Striking Boeing workers reject 35% pay rise over four years | DW News
- Boeing Reports Third Quarter Results
About author
Online


Add a comment
Comments
0 comments on the analysis BOEING COMPANY THE - Daily