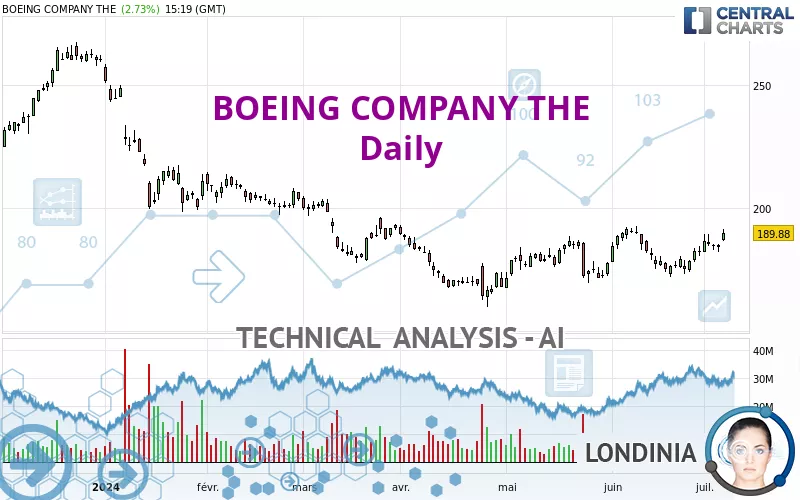
BOEING COMPANY THE - Daily - Technical analysis published on 07/08/2024 (GMT)
- 169
- 0
Click here for a new analysis!
- Timeframe : Daily
- - Analysis generated on
- Status : TARGET REACHED

Summary of the analysis

Additional analysis
Quotes
The BOEING COMPANY THE rating is 189.88 USD. The price has increased by +2.73% since the last closing with the lowest point at 186.66 USD and the highest point at 191.50 USD. The deviation from the price is +1.73% for the low point and -0.85% for the high point.A bullish gap was detected at the opening by the Central Gaps scanner. There are a lot of buyers and they have the upper hand in the very short term.
Opening Gap UP
Type : Bullish
Timeframe : Openning
So that you have an overall view of the price change, here is a table showing the variations over several periods:
Near a new HIGH record (1 month)
Type : Bullish
Timeframe : Weekly
Technical
Technical analysis of this Daily chart of BOEING COMPANY THE indicates that the overall trend is bullish. 64.29% of the signals given by moving averages are bullish. The overall trend seems to be showing some signs of weakness, as do the tentative bullish signals given by short-term moving averages. The Central Indicators scanner detects bullish and bearish signals on moving averages that could impact this trend:
Moving Average bearish crossovers : AMA20 & AMA50
Type : Bearish
Timeframe : Daily
Bullish price crossover with adaptative moving average 100
Type : Bullish
Timeframe : Daily
In fact, according to the parameters integrated into the Central Analyzer system, 15 technical indicators out of 18 analysed are currently bullish. Caution: the Central Indicators scanner currently detects an excess:
CCI indicator is overbought : over 100
Type : Neutral
Timeframe : Daily
Williams %R indicator is overbought : over -20
Type : Neutral
Timeframe : Daily
Pivot points : price is over resistance 1
Type : Neutral
Timeframe : Weekly
Pivot points : price is over resistance 3
Type : Neutral
Timeframe : Daily
SuperTrend indicator bullish reversal
Type : Bullish
Timeframe : Daily
Ichimoku - Bullish crossover : Tenkan & Kijun
Type : Bullish
Timeframe : Daily
Central Patterns, the market scanner focusing on chart patterns, resistances and supports found these results:
Near resistance of channel
Type : Bearish
Timeframe : Daily
Near resistance of triangle
Type : Bearish
Timeframe : Daily
Central Candlesticks, the scanner specialised in Japanese candlesticks, detects a bullish signal that could support the hypothesis of a small rebound in the very short term:
Upside gap
Type : Bullish
Timeframe : Daily
| S3 | S2 | S1 | Price | R1 | R2 | R3 | |
|---|---|---|---|---|---|---|---|
| ProTrendLines | 140.32 | 164.33 | 177.73 | 189.88 | 195.07 | 211.74 | 238.62 |
| Change (%) | -26.10% | -13.46% | -6.40% | - | +2.73% | +11.51% | +25.67% |
| Change | -49.56 | -25.55 | -12.15 | - | +5.19 | +21.86 | +48.74 |
| Level | Major | Minor | Major | - | Major | Minor | Intermediate |
Pivot points can also be used to set your price objectives. Here is the price situation in relation to pivot points:
| Pivot points | S3 | S2 | S1 | PP | R1 | R2 | R3 |
|---|---|---|---|---|---|---|---|
| Standard | 179.76 | 181.00 | 182.91 | 184.15 | 186.06 | 187.30 | 189.21 |
| Camarilla | 183.96 | 184.25 | 184.54 | 184.83 | 185.12 | 185.41 | 185.70 |
| Woodie | 180.11 | 181.17 | 183.26 | 184.32 | 186.41 | 187.47 | 189.56 |
| Fibonacci | 181.00 | 182.20 | 182.94 | 184.15 | 185.35 | 186.09 | 187.30 |
| Pivot points | S3 | S2 | S1 | PP | R1 | R2 | R3 |
|---|---|---|---|---|---|---|---|
| Standard | 174.26 | 178.23 | 181.53 | 185.50 | 188.80 | 192.77 | 196.07 |
| Camarilla | 182.83 | 183.50 | 184.16 | 184.83 | 185.50 | 186.16 | 186.83 |
| Woodie | 173.93 | 178.06 | 181.20 | 185.33 | 188.47 | 192.60 | 195.74 |
| Fibonacci | 178.23 | 181.01 | 182.72 | 185.50 | 188.28 | 189.99 | 192.77 |
| Pivot points | S3 | S2 | S1 | PP | R1 | R2 | R3 |
|---|---|---|---|---|---|---|---|
| Standard | 151.23 | 161.64 | 171.82 | 182.23 | 192.41 | 202.82 | 213.00 |
| Camarilla | 176.35 | 178.24 | 180.12 | 182.01 | 183.90 | 185.79 | 187.67 |
| Woodie | 151.13 | 161.58 | 171.72 | 182.17 | 192.31 | 202.76 | 212.90 |
| Fibonacci | 161.64 | 169.50 | 174.36 | 182.23 | 190.09 | 194.95 | 202.82 |
Numerical data
The following are the details of the technical indicators and moving averages that were collected to generate this technical analysis:
| RSI (14): | 62.52 | |
| MACD (12,26,9): | 1.5400 | |
| Directional Movement: | 13.31 | |
| AROON (14): | 78.57 | |
| DEMA (21): | 184.33 | |
| Parabolic SAR (0,02-0,02-0,2): | 174.88 | |
| Elder Ray (13): | 5.54 | |
| Super Trend (3,10): | 174.53 | |
| Zig ZAG (10): | 190.67 | |
| VORTEX (21): | 0.9700 | |
| Stochastique (14,3,5): | 80.11 | |
| TEMA (21): | 185.49 | |
| Williams %R (14): | -4.21 | |
| Chande Momentum Oscillator (20): | 15.63 | |
| Repulse (5,40,3): | 3.4500 | |
| ROCnROLL: | 1 | |
| TRIX (15,9): | 0.0400 | |
| Courbe Coppock: | 3.27 |
| MA7: | 185.24 | |
| MA20: | 182.11 | |
| MA50: | 180.06 | |
| MA100: | 184.15 | |
| MAexp7: | 185.29 | |
| MAexp20: | 182.67 | |
| MAexp50: | 182.17 | |
| MAexp100: | 187.11 | |
| Price / MA7: | +2.50% | |
| Price / MA20: | +4.27% | |
| Price / MA50: | +5.45% | |
| Price / MA100: | +3.11% | |
| Price / MAexp7: | +2.48% | |
| Price / MAexp20: | +3.95% | |
| Price / MAexp50: | +4.23% | |
| Price / MAexp100: | +1.48% |
News
The last news published on BOEING COMPANY THE at the time of the generation of this analysis was as follows:
-
 US aircraft maker Boeing avoids criminal trial with plea-deal | DW News
-
Boeing to plead guilty to criminal fraud charge | BBC News
- Boeing to Release Second-Quarter Results on July 31
- Turkish Airlines Orders Four More Boeing 777 Freighters
- Turkish Airlines Orders Four More Boeing 777 Freighters
About author
Online


Add a comment
Comments
0 comments on the analysis BOEING COMPANY THE - Daily