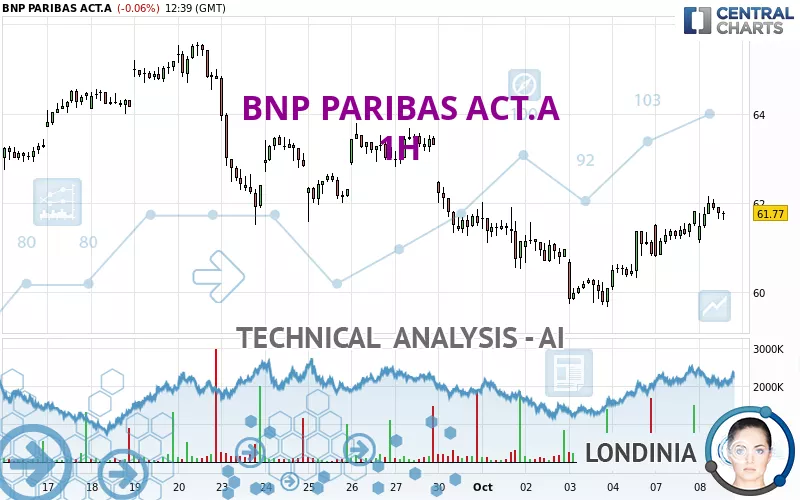
BNP PARIBAS ACT.A - 1H - Technical analysis published on 10/08/2024 (GMT)
- 114
- 0
Click here for a new analysis!
- Timeframe : 1H
- - Analysis generated on
- Status : LEVEL MAINTAINED

Summary of the analysis

Additional analysis
Quotes
The BNP PARIBAS ACT.A rating is 61.77 EUR. The price is lower by -0.07% since the last closing with the lowest point at 61.11 EUR and the highest point at 62.15 EUR. The deviation from the price is +1.08% for the low point and -0.61% for the high point.The Central Gaps scanner detects a bearish opening marking the presence of sellers ahead of buyers at the opening but not sufficiently marked to allow the price to register a quotation gap.
Bearish opening
Type : Bearish
Timeframe : Openning
A study of price movements over other periods shows the following variations:
Near a new LOW record (1 month)
Type : Bearish
Timeframe : Weekly
Technical
Technical analysis of BNP PARIBAS ACT.A in 1H shows an overall slightly bullish trend. 50.00% of the signals given by moving averages are bullish. The overall trend could accelerate as strong bullish signals from short-term moving averages are expected. An assessment of moving averages reveals several bearish signals that could impact this trend:
Bearish trend reversal : adaptative moving average 100
Type : Bearish
Timeframe : 1 hour
Bearish price crossover with adaptative moving average 100
Type : Bearish
Timeframe : 1 hour
In fact, according to the parameters integrated into the Central Analyzer system, 11 technical indicators out of 18 analysed are currently bullish. The Central Indicators scanner found no further results concerning independent technical indicators.
Central Patterns, the market scanner focusing on chart patterns, resistances and supports found these results:
Near horizontal resistance
Type : Bearish
Timeframe : 1 hour
Resistance of channel is broken
Type : Bullish
Timeframe : 1 hour
The presence of these Japanese chandelier patterns detected by Central Candlesticks that could impact the current short-term trend were also noted:
Doji
Type : Neutral
Timeframe : 1 hour
Three black crows
Type : Bearish
Timeframe : 1 hour
| S3 | S2 | S1 | Price | R1 | R2 | R3 | |
|---|---|---|---|---|---|---|---|
| ProTrendLines | 59.75 | 60.52 | 61.53 | 61.77 | 61.99 | 62.72 | 63.98 |
| Change (%) | -3.27% | -2.02% | -0.39% | - | +0.36% | +1.54% | +3.58% |
| Change | -2.02 | -1.25 | -0.24 | - | +0.22 | +0.95 | +2.21 |
| Level | Intermediate | Minor | Major | - | Minor | Minor | Intermediate |
Attention could also be paid to pivot points to set price objectives:
| Pivot points | S3 | S2 | S1 | PP | R1 | R2 | R3 |
|---|---|---|---|---|---|---|---|
| Standard | 60.09 | 60.44 | 61.12 | 61.47 | 62.15 | 62.50 | 63.18 |
| Camarilla | 61.53 | 61.62 | 61.72 | 61.81 | 61.90 | 62.00 | 62.09 |
| Woodie | 60.27 | 60.52 | 61.30 | 61.55 | 62.33 | 62.58 | 63.36 |
| Fibonacci | 60.44 | 60.83 | 61.07 | 61.47 | 61.86 | 62.10 | 62.50 |
| Pivot points | S3 | S2 | S1 | PP | R1 | R2 | R3 |
|---|---|---|---|---|---|---|---|
| Standard | 56.70 | 58.19 | 59.52 | 61.01 | 62.34 | 63.83 | 65.16 |
| Camarilla | 60.09 | 60.34 | 60.60 | 60.86 | 61.12 | 61.38 | 61.64 |
| Woodie | 56.63 | 58.15 | 59.45 | 60.97 | 62.27 | 63.79 | 65.09 |
| Fibonacci | 58.19 | 59.26 | 59.93 | 61.01 | 62.08 | 62.75 | 63.83 |
| Pivot points | S3 | S2 | S1 | PP | R1 | R2 | R3 |
|---|---|---|---|---|---|---|---|
| Standard | 54.47 | 57.50 | 59.53 | 62.56 | 64.59 | 67.62 | 69.65 |
| Camarilla | 60.16 | 60.62 | 61.09 | 61.55 | 62.01 | 62.48 | 62.94 |
| Woodie | 53.96 | 57.25 | 59.02 | 62.31 | 64.08 | 67.37 | 69.14 |
| Fibonacci | 57.50 | 59.44 | 60.63 | 62.56 | 64.50 | 65.69 | 67.62 |
Numerical data
The following is the status of technical indicators and moving averages registered at the time this technical analysis was created:
| RSI (14): | 58.79 | |
| MACD (12,26,9): | 0.2600 | |
| Directional Movement: | 5.87 | |
| AROON (14): | 78.57 | |
| DEMA (21): | 61.71 | |
| Parabolic SAR (0,02-0,02-0,2): | 61.58 | |
| Elder Ray (13): | 0.21 | |
| Super Trend (3,10): | 60.78 | |
| Zig ZAG (10): | 61.74 | |
| VORTEX (21): | 1.1600 | |
| Stochastique (14,3,5): | 73.74 | |
| TEMA (21): | 62.00 | |
| Williams %R (14): | -32.82 | |
| Chande Momentum Oscillator (20): | 0.45 | |
| Repulse (5,40,3): | -0.0600 | |
| ROCnROLL: | 1 | |
| TRIX (15,9): | 0.0500 | |
| Courbe Coppock: | 2.49 |
| MA7: | 61.16 | |
| MA20: | 62.68 | |
| MA50: | 61.70 | |
| MA100: | 62.49 | |
| MAexp7: | 61.72 | |
| MAexp20: | 61.41 | |
| MAexp50: | 61.35 | |
| MAexp100: | 61.77 | |
| Price / MA7: | +1.00% | |
| Price / MA20: | -1.45% | |
| Price / MA50: | +0.11% | |
| Price / MA100: | -1.15% | |
| Price / MAexp7: | +0.08% | |
| Price / MAexp20: | +0.59% | |
| Price / MAexp50: | +0.68% | |
| Price / MAexp100: | -0% |
News
Don't forget to follow the news on BNP PARIBAS ACT.A. At the time of publication of this analysis, the latest news was as follows:
- GROUPE BNP PARIBAS : Release of the second amendment to the Universal registration document and annual financial report 2023
- BNP Paribas : Exclusive negotiation with Axa for the acquisition of Axa Investment Managers and a long-term partnership in asset management
- BNP Paribas Factoring selects Lendscape to further strengthen its European operations
- BNP PARIBAS SA: Disclosure for G-SIIs indicators as of 31 December 2023
- BNP Paribas Group: Release of the first amendment to the 2023 URD
About author
Online


Add a comment
Comments
0 comments on the analysis BNP PARIBAS ACT.A - 1H