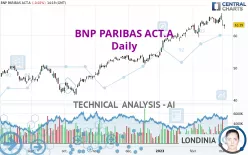
BNP PARIBAS ACT.A - Daily - Technical analysis published on 03/02/2023 (GMT)
- 260
- 0
Click here for a new analysis!
- Timeframe : Daily
- - Analysis generated on
- Status : INVALID

Summary of the analysis

Additional analysis
Quotes
BNP PARIBAS ACT.A rating 63.39 EUR. The price is lower by -0.02% since the last closing and was between 62.16 EUR and 63.57 EUR. This implies that the price is at +1.98% from its lowest and at -0.28% from its highest.A bearish gap was detected at the opening by the Central Gaps scanner. There are a lot of sellers and they have the upper hand in the very short term.
Opening Gap DOWN
Type : Bearish
Timeframe : Openning
Here is a more detailed summary of the historical variations registered by BNP PARIBAS ACT.A:
New HIGH record (5 years)
Type : Bullish
Timeframe : Weekly
Near a new LOW record (1 month)
Type : Bearish
Timeframe : Weekly
Technical
A technical analysis in Daily of this BNP PARIBAS ACT.A chart shows a bullish trend. The signals given by moving averages are 75.00% bullish. This bullish trend could slow down given the neutral signals currently being given by short-term moving averages. The Central Indicators scanner detects a bearish signal on moving averages that could impact this trend:
Bearish trend reversal : adaptative moving average 20
Type : Bearish
Timeframe : Daily
In fact, Central Analyzer took into account 18 technical indicators and the result was as follows: 3 are bullish, 10 are neutral and 5 are bearish. Other results related to technical indicators were also found by the Central Indicators scanner:
Parabolic SAR indicator bearish reversal
Type : Bearish
Timeframe : Daily
Momentum indicator is back under 0
Type : Bearish
Timeframe : Daily
An analysis of the price chart with the Central Patterns scanner (detector of chart patterns and resistances and supports) shows a result that can have an impact on the price change:
Near support of channel
Type : Bullish
Timeframe : Daily
The Central Candlesticks scanner which studies Japanese candlesticks did not detect anything.
| S3 | S2 | S1 | Price | R1 | |
|---|---|---|---|---|---|
| ProTrendLines | 45.63 | 50.55 | 62.38 | 63.39 | 65.80 |
| Change (%) | -28.02% | -20.26% | -1.59% | - | +3.80% |
| Change | -17.76 | -12.84 | -1.01 | - | +2.41 |
| Level | Minor | Major | Major | - | Major |
To determine price objectives, it is also possible to use the pivot points. Here is the price position in relation to pivot points:
| Pivot points | S3 | S2 | S1 | PP | R1 | R2 | R3 |
|---|---|---|---|---|---|---|---|
| Standard | 60.89 | 61.99 | 62.70 | 63.80 | 64.51 | 65.61 | 66.32 |
| Camarilla | 62.90 | 63.07 | 63.23 | 63.40 | 63.57 | 63.73 | 63.90 |
| Woodie | 60.69 | 61.89 | 62.50 | 63.70 | 64.31 | 65.51 | 66.12 |
| Fibonacci | 61.99 | 62.69 | 63.11 | 63.80 | 64.50 | 64.92 | 65.61 |
| Pivot points | S3 | S2 | S1 | PP | R1 | R2 | R3 |
|---|---|---|---|---|---|---|---|
| Standard | 60.64 | 62.10 | 62.99 | 64.45 | 65.34 | 66.80 | 67.69 |
| Camarilla | 63.24 | 63.46 | 63.68 | 63.89 | 64.11 | 64.32 | 64.54 |
| Woodie | 60.37 | 61.96 | 62.72 | 64.31 | 65.07 | 66.66 | 67.42 |
| Fibonacci | 62.10 | 62.99 | 63.55 | 64.45 | 65.34 | 65.90 | 66.80 |
| Pivot points | S3 | S2 | S1 | PP | R1 | R2 | R3 |
|---|---|---|---|---|---|---|---|
| Standard | 53.92 | 56.72 | 61.43 | 64.23 | 68.94 | 71.74 | 76.45 |
| Camarilla | 64.09 | 64.77 | 65.46 | 66.15 | 66.84 | 67.53 | 68.22 |
| Woodie | 54.89 | 57.20 | 62.40 | 64.71 | 69.91 | 72.22 | 77.42 |
| Fibonacci | 56.72 | 59.59 | 61.36 | 64.23 | 67.10 | 68.87 | 71.74 |
Numerical data
The following are the details of the technical indicators and moving averages that were collected to generate this technical analysis:
| RSI (14): | 51.32 | |
| MACD (12,26,9): | 1.0400 | |
| Directional Movement: | 0.46 | |
| AROON (14): | -14.29 | |
| DEMA (21): | 65.43 | |
| Parabolic SAR (0,02-0,02-0,2): | 67.02 | |
| Elder Ray (13): | -1.43 | |
| Super Trend (3,10): | 61.93 | |
| Zig ZAG (10): | 63.50 | |
| VORTEX (21): | 0.9000 | |
| Stochastique (14,3,5): | 37.77 | |
| TEMA (21): | 64.90 | |
| Williams %R (14): | -72.84 | |
| Chande Momentum Oscillator (20): | -0.90 | |
| Repulse (5,40,3): | 1.9700 | |
| ROCnROLL: | -1 | |
| TRIX (15,9): | 0.3300 | |
| Courbe Coppock: | 4.16 |
| MA7: | 64.44 | |
| MA20: | 64.09 | |
| MA50: | 60.79 | |
| MA100: | 55.68 | |
| MAexp7: | 64.36 | |
| MAexp20: | 63.82 | |
| MAexp50: | 60.97 | |
| MAexp100: | 57.28 | |
| Price / MA7: | -1.63% | |
| Price / MA20: | -1.09% | |
| Price / MA50: | +4.28% | |
| Price / MA100: | +13.85% | |
| Price / MAexp7: | -1.51% | |
| Price / MAexp20: | -0.67% | |
| Price / MAexp50: | +3.97% | |
| Price / MAexp100: | +10.67% |
News
Don't forget to follow the news on BNP PARIBAS ACT.A. At the time of publication of this analysis, the latest news was as follows:
- BMO Financial Group and BNP Paribas Announce Global Commercial Agreement
- BNP Paribas Cardif and Lemonade Join Forces to Offer 100% Online Renters Insurance
- BNP Paribas Group: receipt of all regulatory approvals for the completion of the sale of Bank of the West to BMO Financial Group
- BNP Paribas SA: NOTIFICATION BY THE ECB OF THE 2022 SUPERVISORY REVIEW AND EVALUATION PROCESS (SREP)
- AQMetrics appoints former BNP Paribas Securities Services and Caceis exec Vincent Marc in Luxembourg
About author
Online


Add a comment
Comments
0 comments on the analysis BNP PARIBAS ACT.A - Daily