BLACKROCK INC. - 1H - Technical analysis published on 11/21/2023 (GMT)
- 193
- 0
Click here for a new analysis!
- Timeframe : 1H
- - Analysis generated on
- Status : LEVEL MAINTAINED

Summary of the analysis

Additional analysis
Quotes
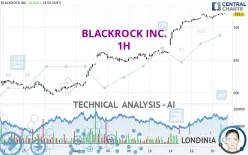
The BLACKROCK INC. rating is 720.75 USD. On the day, this instrument lost -0.02% and was between 718.72 USD and 721.19 USD. This implies that the price is at +0.28% from its lowest and at -0.06% from its highest.A bearish opening was detected by the Central Gaps scanner. Sellers are trying to impose a bearish trend in the very short term.
Bearish opening
Type : Bearish
Timeframe : Openning
So that you have an overall view of the price change, here is a table showing the variations over several periods:
New HIGH record (1 month)
Type : Bullish
Timeframe : Weekly
Technical
Technical analysis of this 1H chart of BLACKROCK INC. indicates that the overall trend is strongly bullish. 92.86% of the signals given by moving averages are bullish. This strongly bullish trend is supported by the strong bullish signals given by short-term moving averages. The Central Indicators scanner detects a bearish signal on moving averages that could impact this trend:
Moving Average bearish crossovers : AMA20 & AMA50
Type : Bearish
Timeframe : 1 hour
Technical indicators are slightly bullish. There is therefore considerable uncertainty about the continuation of the increase.
But beware of excesses. The Central Indicators scanner currently detects this:
RSI indicator is overbought : over 70
Type : Neutral
Timeframe : 1 hour
CCI indicator: bearish divergence
Type : Bearish
Timeframe : 1 hour
Williams %R indicator is overbought : over -20
Type : Neutral
Timeframe : 1 hour
Central Patterns, the market scanner focusing on chart patterns, resistances and supports found this result:
Near horizontal support
Type : Bullish
Timeframe : 1 hour
The Central Candlesticks scanner, specialised in Japanese candlesticks, did not identify any signals.
| S3 | S2 | S1 | Price | R1 | R2 | R3 | |
|---|---|---|---|---|---|---|---|
| ProTrendLines | 661.64 | 674.90 | 706.50 | 720.75 | 720.84 | 734.47 | 759.68 |
| Change (%) | -8.20% | -6.36% | -1.98% | - | +0.01% | +1.90% | +5.40% |
| Change | -59.11 | -45.85 | -14.25 | - | +0.09 | +13.72 | +38.93 |
| Level | Intermediate | Minor | Intermediate | - | Minor | Minor | Major |
To determine price objectives, it is also possible to use the pivot points. Here is the price position in relation to pivot points:
| Pivot points | S3 | S2 | S1 | PP | R1 | R2 | R3 |
|---|---|---|---|---|---|---|---|
| Standard | 705.25 | 708.68 | 714.80 | 718.23 | 724.35 | 727.78 | 733.90 |
| Camarilla | 718.29 | 719.17 | 720.05 | 720.92 | 721.80 | 722.67 | 723.55 |
| Woodie | 706.60 | 709.35 | 716.15 | 718.90 | 725.70 | 728.45 | 735.25 |
| Fibonacci | 708.68 | 712.33 | 714.58 | 718.23 | 721.88 | 724.13 | 727.78 |
| Pivot points | S3 | S2 | S1 | PP | R1 | R2 | R3 |
|---|---|---|---|---|---|---|---|
| Standard | 613.69 | 635.91 | 676.39 | 698.61 | 739.09 | 761.31 | 801.79 |
| Camarilla | 699.62 | 705.37 | 711.11 | 716.86 | 722.61 | 728.36 | 734.10 |
| Woodie | 622.81 | 640.48 | 685.51 | 703.18 | 748.21 | 765.88 | 810.91 |
| Fibonacci | 635.91 | 659.87 | 674.66 | 698.61 | 722.57 | 737.36 | 761.31 |
| Pivot points | S3 | S2 | S1 | PP | R1 | R2 | R3 |
|---|---|---|---|---|---|---|---|
| Standard | 533.14 | 564.66 | 588.47 | 619.99 | 643.80 | 675.32 | 699.13 |
| Camarilla | 597.06 | 602.14 | 607.21 | 612.28 | 617.35 | 622.42 | 627.50 |
| Woodie | 529.29 | 562.73 | 584.62 | 618.06 | 639.95 | 673.39 | 695.28 |
| Fibonacci | 564.66 | 585.80 | 598.85 | 619.99 | 641.13 | 654.18 | 675.32 |
Numerical data
The following are the details of the technical indicators and moving averages that were collected to generate this technical analysis:
| RSI (14): | 69.94 | |
| MACD (12,26,9): | 5.9700 | |
| Directional Movement: | 18.56 | |
| AROON (14): | 42.86 | |
| DEMA (21): | 724.48 | |
| Parabolic SAR (0,02-0,02-0,2): | 714.44 | |
| Elder Ray (13): | 1.81 | |
| Super Trend (3,10): | 712.88 | |
| Zig ZAG (10): | 720.81 | |
| VORTEX (21): | 1.1200 | |
| Stochastique (14,3,5): | 94.64 | |
| TEMA (21): | 721.53 | |
| Williams %R (14): | -17.38 | |
| Chande Momentum Oscillator (20): | 0.95 | |
| Repulse (5,40,3): | 0.3800 | |
| ROCnROLL: | 1 | |
| TRIX (15,9): | 0.1500 | |
| Courbe Coppock: | 1.14 |
| MA7: | 705.84 | |
| MA20: | 658.25 | |
| MA50: | 652.81 | |
| MA100: | 676.76 | |
| MAexp7: | 719.75 | |
| MAexp20: | 715.33 | |
| MAexp50: | 699.22 | |
| MAexp100: | 678.67 | |
| Price / MA7: | +2.11% | |
| Price / MA20: | +9.49% | |
| Price / MA50: | +10.41% | |
| Price / MA100: | +6.50% | |
| Price / MAexp7: | +0.14% | |
| Price / MAexp20: | +0.76% | |
| Price / MAexp50: | +3.08% | |
| Price / MAexp100: | +6.20% |
News
Don't forget to follow the news on BLACKROCK INC.. At the time of publication of this analysis, the latest news was as follows:
- BlackRock Greater Europe Investment Trust Plc - Submission of Documents
- BlackRock Income and Growth Investment Trust Plc - Portfolio Update
- BlackRock World Mining Trust Plc - Portfolio Update
- BlackRock Greater Europe Investment Trust Plc - Portfolio Update
- BlackRock® Canada Announces November Cash Distributions for the iShares® ETFs and Partial Waiver of Annual Management Fee Payable by iShares MSCI Min Vol Emerging Markets Index ETF
About author
Online


Add a comment
Comments
0 comments on the analysis BLACKROCK INC. - 1H