| Open: | - |
| Change: | - |
| Volume: | - |
| Low: | - |
| High: | - |
| High / Low range: | - |
| Type: | Stocks |
| Ticker: | BLK |
| ISIN: |
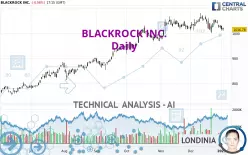
BLACKROCK INC. - Daily - Technical analysis published on 01/03/2025 (GMT)
- 130
- 0
- 01/03/2025 - 17:35
Click here for a new analysis!
- Timeframe : Daily
- - Analysis generated on 01/03/2025 - 17:35
- Status : INVALID

Summary of the analysis

Additional analysis
Quotes
The BLACKROCK INC. price is 1,016.78 USD. On the day, this instrument lost -0.06% and was traded between 1,010.00 USD and 1,024.00 USD over the period. The price is currently at +0.67% from its lowest and -0.71% from its highest.So that you have an overall view of the price change, here is a table showing the variations over several periods:
Near a new HIGH record (5 years)
Type : Bullish
Timeframe : Weekly
Near a new HIGH record (1st january)
Type : Bullish
Timeframe : Weekly
New LOW record (1st january)
Type : Bearish
Timeframe : Weekly
Near a new LOW record (1 month)
Type : Bearish
Timeframe : Weekly
Technical
Technical analysis of this Daily chart of BLACKROCK INC. indicates that the overall trend is slightly bullish. 57.14% of the signals given by moving averages are bullish. Caution: the strong bearish signals currently given by short-term moving averages indicate that a trend reversal may be taking place. An assessment of moving averages reveals a bearish signal that could impact this trend:
Bearish trend reversal : Moving Average 20
Type : Bearish
Timeframe : Daily
In fact, 11 technical indicators on 18 studied are currently positioned bearish. But beware of excesses. The Central Indicators scanner currently detects this:
RSI indicator: bullish divergence
Type : Bullish
Timeframe : Daily
Pivot points : price is under support 1
Type : Neutral
Timeframe : Weekly
Price is back under the pivot point
Type : Bearish
Timeframe : Daily
An analysis of the price chart with the Central Patterns scanner (detector of chart patterns and resistances and supports) shows a result that can have an impact on the price change:
Horizontal resistance is broken
Type : Bullish
Timeframe : Daily
Central Candlesticks, the scanner specialised in Japanese candlesticks, detects a bearish signal that could support the hypothesis of a small drop in the very short term:
Three black crows
Type : Bearish
Timeframe : Daily
| S3 | S2 | S1 | Price | R1 | |
|---|---|---|---|---|---|
| ProTrendLines | 899.16 | 969.28 | 1,015.70 | 1,016.78 | 1,048.66 |
| Change (%) | -11.57% | -4.67% | -0.11% | - | +3.14% |
| Change | -117.62 | -47.50 | -1.08 | - | +31.88 |
| Level | Major | Minor | Major | - | Major |
Attention could also be paid to pivot points to set price objectives:
| Pivot points | S3 | S2 | S1 | PP | R1 | R2 | R3 |
|---|---|---|---|---|---|---|---|
| Standard | 988.80 | 1,000.40 | 1,008.90 | 1,020.50 | 1,029.00 | 1,040.60 | 1,049.10 |
| Camarilla | 1,011.87 | 1,013.72 | 1,015.56 | 1,017.40 | 1,019.24 | 1,021.09 | 1,022.93 |
| Woodie | 987.25 | 999.63 | 1,007.35 | 1,019.73 | 1,027.45 | 1,039.83 | 1,047.55 |
| Fibonacci | 1,000.40 | 1,008.08 | 1,012.82 | 1,020.50 | 1,028.18 | 1,032.92 | 1,040.60 |
| Pivot points | S3 | S2 | S1 | PP | R1 | R2 | R3 |
|---|---|---|---|---|---|---|---|
| Standard | 991.73 | 1,007.55 | 1,025.86 | 1,041.68 | 1,059.99 | 1,075.81 | 1,094.12 |
| Camarilla | 1,034.79 | 1,037.92 | 1,041.05 | 1,044.18 | 1,047.31 | 1,050.44 | 1,053.57 |
| Woodie | 992.99 | 1,008.17 | 1,027.12 | 1,042.30 | 1,061.25 | 1,076.43 | 1,095.38 |
| Fibonacci | 1,007.55 | 1,020.58 | 1,028.64 | 1,041.68 | 1,054.71 | 1,062.77 | 1,075.81 |
| Pivot points | S3 | S2 | S1 | PP | R1 | R2 | R3 |
|---|---|---|---|---|---|---|---|
| Standard | 910.09 | 956.03 | 990.57 | 1,036.51 | 1,071.05 | 1,116.99 | 1,151.53 |
| Camarilla | 1,002.98 | 1,010.36 | 1,017.73 | 1,025.11 | 1,032.49 | 1,039.87 | 1,047.24 |
| Woodie | 904.39 | 953.18 | 984.87 | 1,033.66 | 1,065.35 | 1,114.14 | 1,145.83 |
| Fibonacci | 956.03 | 986.77 | 1,005.77 | 1,036.51 | 1,067.25 | 1,086.25 | 1,116.99 |
Numerical data
The following is the status of the technical indicators and moving averages at the time of publication of this technical analysis:
| RSI (14): | 43.08 | |
| MACD (12,26,9): | -0.1900 | |
| Directional Movement: | -8.80 | |
| AROON (14): | -42.86 | |
| DEMA (21): | 1,036.34 | |
| Parabolic SAR (0,02-0,02-0,2): | 1,049.22 | |
| Elder Ray (13): | -15.75 | |
| Super Trend (3,10): | 1,011.36 | |
| Zig ZAG (10): | 1,016.56 | |
| VORTEX (21): | 0.9700 | |
| Stochastique (14,3,5): | 23.66 | |
| TEMA (21): | 1,026.18 | |
| Williams %R (14): | -79.17 | |
| Chande Momentum Oscillator (20): | -48.10 | |
| Repulse (5,40,3): | -1.6000 | |
| ROCnROLL: | -1 | |
| TRIX (15,9): | 0.0600 | |
| Courbe Coppock: | 4.19 |
| MA7: | 1,034.27 | |
| MA20: | 1,041.57 | |
| MA50: | 1,024.62 | |
| MA100: | 969.42 | |
| MAexp7: | 1,027.90 | |
| MAexp20: | 1,033.83 | |
| MAexp50: | 1,017.03 | |
| MAexp100: | 974.09 | |
| Price / MA7: | -1.69% | |
| Price / MA20: | -2.38% | |
| Price / MA50: | -0.77% | |
| Price / MA100: | +4.89% | |
| Price / MAexp7: | -1.08% | |
| Price / MAexp20: | -1.65% | |
| Price / MAexp50: | -0.02% | |
| Price / MAexp100: | +4.38% |
News
The latest news and videos published on BLACKROCK INC. at the time of the analysis were as follows:
- 01/03/2025 - 17:18 BlackRock American Income Trust Plc - Holding(s) in Company
- 01/02/2025 - 21:30 Distribution Dates and Amounts Announced for Certain BlackRock Closed-End Funds
- 01/02/2025 - 21:30 Certain BlackRock Closed-End Funds Announce Tender Offer in Conjunction with Results of the Quarterly Measurement Period of their Discount Management Programs
- 01/02/2025 - 18:19 BlackRock Latin American Investment Trust Plc - Disclosure of portfolio holdings
- 01/02/2025 - 17:20 BlackRock Frontiers Investment Trust Plc - Disclosure of Portfolio Holdings
About author
Online


Add a comment
Comments
0 comments on the analysis BLACKROCK INC. - Daily