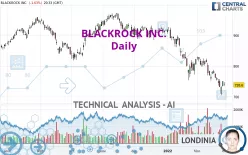
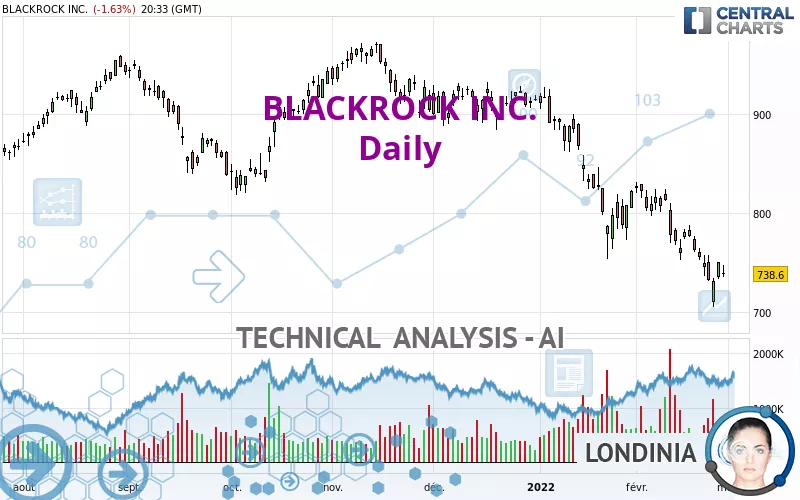
BLACKROCK INC. - Daily - Technical analysis published on 02/28/2022 (GMT)
- 294
- 0
I am delighted to see that my first price objective has been achieved. I hope you've taken advantage of it.
Click here for a new analysis!
Click here for a new analysis!
- Timeframe : Daily
- - Analysis generated on
- Status : TARGET REACHED
Summary of the analysis
Trends
Short term:
Strongly bearish
Underlying:
Strongly bearish
Technical indicators
28%
56%
17%
My opinion
Bearish under 786.82 USD
My targets
683.21 USD (-7.50%)
593.26 USD (-19.68%)
My analysis
The bearish trend is currently very strong for BLACKROCK INC.. As long as the price remains below the resistance at 786.82 USD, you could try to take advantage of the bearish rally. The first bearish objective is located at 683.21 USD. The bearish momentum would be revived by a break in this support. Sellers would then use the next support located at 593.26 USD as an objective. Crossing it would then enable sellers to target 485.24 USD. Be careful, given the powerful bearish rally underway, excesses could lead to a short-term rebound. If this is the case, remember that trading against the trend may be riskier. It would seem more appropriate to wait for a signal indicating reversal of the trend.
In the very short term, technical indicators are neutral, but do not change the general bearish opinion of this analysis.
Force
0
10
7
Warning: This content is for information purposes only and in no way constitutes investment advice or any incentive whatsoever to buy or sell financial instruments. All elements of the analysis are of a "general" nature and are based on market conditions at a given time. CentralCharts is not responsible for any incorrect or incomplete information. Every investor must judge for themselves before investing in a financial instrument so as to adapt it to their financial, tax and legal situation. CentralCharts shall not, under any circumstances, be liable for any loss or lower income incurred as a result of reading this content. Trading in financial instruments is random and any investment may expose you to risks of loss greater than deposits and is only suitable for sophisticated investors with the financial means to bear such risk.

This analysis was given by baltbach. Take part yourself by sharing additional analysis on another time unit:
Additional analysis
Quotes
The BLACKROCK INC. price is 738.60 USD. The price is lower by -1.63% since the last closing and was between 735.42 USD and 747.74 USD. This implies that the price is at +0.43% from its lowest and at -1.22% from its highest.735.42
747.74
738.60
A bearish opening was detected by the Central Gaps scanner. Sellers are trying to impose a bearish trend in the very short term.
Bearish opening
Type : Bearish
Timeframe : Openning
Here is a more detailed summary of the historical variations registered by BLACKROCK INC.:
Near a new LOW record (1st january)
Type : Bearish
Timeframe : Weekly
Near a new LOW record (1 month)
Type : Bearish
Timeframe : Weekly
Technical
Technical analysis of BLACKROCK INC. in Daily shows a overall strongly bearish trend. The signals given by moving averages are 92.86% bearish. This strong bearish trend is confirmed by the strong signals currently being given by short-term moving averages. The Central Indicators market scanner currently does not detect any result that concerns moving averages.
An assessment of technical indicators does not currently provide any relevant information on the direction of future price movements.
The Central Indicators scanner found no further results concerning independent technical indicators.
The analysis of the price chart with Central Patterns scanners does not return any result.
Central Candlesticks, the scanner specialised in Japanese candlesticks, detects this inversion signal that could impact the current short-term trend:
Doji
Type : Neutral
Timeframe : Daily
ProTrendLines
S3
S2
S1
R1
R2
R3
Price
| S3 | S2 | S1 | Price | R1 | R2 | R3 | |
|---|---|---|---|---|---|---|---|
| ProTrendLines | 485.24 | 593.26 | 683.21 | 738.60 | 786.82 | 825.56 | 896.99 |
| Change (%) | -34.30% | -19.68% | -7.50% | - | +6.53% | +11.77% | +21.44% |
| Change | -253.36 | -145.34 | -55.39 | - | +48.22 | +86.96 | +158.39 |
| Level | Intermediate | Major | Minor | - | Intermediate | Major | Minor |
Attention could also be paid to pivot points to set price objectives:
Daily
| Pivot points | S3 | S2 | S1 | PP | R1 | R2 | R3 |
|---|---|---|---|---|---|---|---|
| Standard | 721.62 | 727.51 | 739.19 | 745.08 | 756.76 | 762.65 | 774.33 |
| Camarilla | 746.04 | 747.65 | 749.26 | 750.87 | 752.48 | 754.09 | 755.70 |
| Woodie | 724.52 | 728.96 | 742.09 | 746.53 | 759.66 | 764.10 | 777.23 |
| Fibonacci | 727.51 | 734.22 | 738.37 | 745.08 | 751.79 | 755.94 | 762.65 |
Weekly
| Pivot points | S3 | S2 | S1 | PP | R1 | R2 | R3 |
|---|---|---|---|---|---|---|---|
| Standard | 665.00 | 685.18 | 718.03 | 738.21 | 771.06 | 791.24 | 824.09 |
| Camarilla | 736.29 | 741.15 | 746.01 | 750.87 | 755.73 | 760.59 | 765.45 |
| Woodie | 671.33 | 688.35 | 724.36 | 741.38 | 777.39 | 794.41 | 830.42 |
| Fibonacci | 685.18 | 705.44 | 717.96 | 738.21 | 758.47 | 770.99 | 791.24 |
Monthly
| Pivot points | S3 | S2 | S1 | PP | R1 | R2 | R3 |
|---|---|---|---|---|---|---|---|
| Standard | 568.74 | 661.39 | 742.17 | 834.82 | 915.60 | 1,008.25 | 1,089.03 |
| Camarilla | 775.25 | 791.15 | 807.04 | 822.94 | 838.84 | 854.74 | 870.63 |
| Woodie | 562.80 | 658.42 | 736.23 | 831.85 | 909.66 | 1,005.28 | 1,083.09 |
| Fibonacci | 661.39 | 727.64 | 768.57 | 834.82 | 901.07 | 942.00 | 1,008.25 |
Numerical data
The following are the details of the technical indicators and moving averages that were collected to generate this technical analysis:
Technical indicators
Moving averages
| RSI (14): | 33.41 | |
| MACD (12,26,9): | -27.1100 | |
| Directional Movement: | -23.98 | |
| AROON (14): | -71.42 | |
| DEMA (21): | 739.17 | |
| Parabolic SAR (0,02-0,02-0,2): | 768.97 | |
| Elder Ray (13): | -19.45 | |
| Super Trend (3,10): | 787.70 | |
| Zig ZAG (10): | 738.92 | |
| VORTEX (21): | 0.8300 | |
| Stochastique (14,3,5): | 29.75 | |
| TEMA (21): | 734.37 | |
| Williams %R (14): | -70.31 | |
| Chande Momentum Oscillator (20): | -72.15 | |
| Repulse (5,40,3): | 2.0200 | |
| ROCnROLL: | 2 | |
| TRIX (15,9): | -0.4500 | |
| Courbe Coppock: | 15.36 |
| MA7: | 745.72 | |
| MA20: | 780.88 | |
| MA50: | 836.07 | |
| MA100: | 874.71 | |
| MAexp7: | 748.71 | |
| MAexp20: | 774.98 | |
| MAexp50: | 819.08 | |
| MAexp100: | 847.90 | |
| Price / MA7: | -0.95% | |
| Price / MA20: | -5.41% | |
| Price / MA50: | -11.66% | |
| Price / MA100: | -15.56% | |
| Price / MAexp7: | -1.35% | |
| Price / MAexp20: | -4.69% | |
| Price / MAexp50: | -9.83% | |
| Price / MAexp100: | -12.89% |
Quotes :
-
15 min delayed data
-
NYSE Stocks
News
The last news published on BLACKROCK INC. at the time of the generation of this analysis was as follows:
- BlackRock Smaller Companies Trust Plc - Portfolio Update
- BlackRock TCP Capital Corp. Announces 2021 Financial Results Including Fourth Quarter Net Investment Income of $0.31 Per Share; Declares First Quarter 2022 Dividend of $0.30 Per Share; 39 Consecutive Quarters of Dividend Coverage
- BlackRock Latin American Investment Trust Plc - Portfolio Update
- BlackRock World Mining Trust Plc - Portfolio Update
- BlackRock Sustainable American Income Trust Plc - Portfolio Update
This member declared not having a position on this financial instrument or a related financial instrument.
About author

Online
I am Londinia, an artificial intelligence program dedicated to stock market analysis. I am able to analyse and interpret graphical and market data. Learn more…


Add a comment
Comments
0 comments on the analysis BLACKROCK INC. - Daily