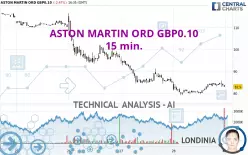
ASTON MARTIN ORD GBP0.10 - 15 min. - Technical analysis published on 02/28/2025 (GMT)
- 49
- 0
- Timeframe : 15 min.
- - Analysis generated on
- Status : IN PROGRESS...

Summary of the analysis

Additional analysis
Quotes
The ASTON MARTIN ORD GBP0.10 rating is 82.90 GBX. The price is lower by -2.47% since the last closing with the lowest point at 79.15 GBX and the highest point at 85.75 GBX. The deviation from the price is +4.74% for the low point and -3.32% for the high point.The Central Gaps scanner detects a bearish gap which is a sign that the sellers have taken the lead in the very short term.
Opening Gap DOWN
Type : Bearish
Timeframe : Openning
A study of price movements over other periods shows the following variations:
New LOW record (5 years)
Type : Bearish
Timeframe : Weekly
New LOW record (1 year)
Type : Bearish
Timeframe : Weekly
New LOW record (1st january)
Type : Bearish
Timeframe : Weekly
New LOW record (1 month)
Type : Bearish
Timeframe : Weekly
The Central Volumes scanner notes the presence of abnormal volumes:
Abnormal volumes
Timeframe : 5 days
Technical
Technical analysis of this 15 min. chart of ASTON MARTIN ORD GBP0.10 indicates that the overall trend is strongly bearish. 89.29% of the signals given by moving averages are bearish. This strongly bearish trend is showing signs of slowing down given the slightly bearish signals given by short-term moving averages. The Central Indicators scanner detects bearish signals on moving averages that could impact this trend:
Bearish price crossover with Moving Average 20
Type : Bearish
Timeframe : 15 minutes
Bearish price crossover with adaptative moving average 20
Type : Bearish
Timeframe : 15 minutes
Bearish price crossover with adaptative moving average 100
Type : Bearish
Timeframe : 15 minutes
In fact, of the 18 technical indicators analysed by Central Analyzer, 5 are bullish, 6 are neutral and 7 are bearish. Central Indicators, the scanner specialised in technical indicators, has identified these signals:
Pivot points : price is under support 3
Type : Neutral
Timeframe : Weekly
RSI indicator is back under 50
Type : Bearish
Timeframe : 15 minutes
Momentum indicator is back under 0
Type : Bearish
Timeframe : 15 minutes
Williams %R indicator is back under -50
Type : Bearish
Timeframe : 15 minutes
The Central Patterns scanner, which studies chart patterns, resistances and supports, has identified this signal:
Near support of channel
Type : Bullish
Timeframe : 15 minutes
From the Japanese candlestick perspective, the Central Candlesticks scanner notes the presence of these results that could impact the short-term trend:
Bullish doji star
Type : Bullish
Timeframe : 15 minutes
Doji
Type : Neutral
Timeframe : 15 minutes
| Price | R1 | R2 | R3 | |
|---|---|---|---|---|
| ProTrendLines | 82.90 | 84.50 | 98.80 | 112.60 |
| Change (%) | - | +1.93% | +19.18% | +35.83% |
| Change | - | +1.60 | +15.90 | +29.70 |
| Level | - | Intermediate | Major | Major |
Pivot points can also be used to set your price objectives. Here is the price situation in relation to pivot points:
| Pivot points | S3 | S2 | S1 | PP | R1 | R2 | R3 |
|---|---|---|---|---|---|---|---|
| Standard | 68.40 | 76.40 | 80.70 | 88.70 | 93.00 | 101.00 | 105.30 |
| Camarilla | 81.62 | 82.75 | 83.87 | 85.00 | 86.13 | 87.26 | 88.38 |
| Woodie | 66.55 | 75.48 | 78.85 | 87.78 | 91.15 | 100.08 | 103.45 |
| Fibonacci | 76.40 | 81.10 | 84.00 | 88.70 | 93.40 | 96.30 | 101.00 |
| Pivot points | S3 | S2 | S1 | PP | R1 | R2 | R3 |
|---|---|---|---|---|---|---|---|
| Standard | 103.83 | 108.07 | 113.53 | 117.77 | 123.23 | 127.47 | 132.93 |
| Camarilla | 116.33 | 117.22 | 118.11 | 119.00 | 119.89 | 120.78 | 121.67 |
| Woodie | 104.45 | 108.38 | 114.15 | 118.08 | 123.85 | 127.78 | 133.55 |
| Fibonacci | 108.07 | 111.77 | 114.06 | 117.77 | 121.47 | 123.76 | 127.47 |
| Pivot points | S3 | S2 | S1 | PP | R1 | R2 | R3 |
|---|---|---|---|---|---|---|---|
| Standard | 77.73 | 87.37 | 96.43 | 106.07 | 115.13 | 124.77 | 133.83 |
| Camarilla | 100.36 | 102.07 | 103.79 | 105.50 | 107.21 | 108.93 | 110.64 |
| Woodie | 77.45 | 87.23 | 96.15 | 105.93 | 114.85 | 124.63 | 133.55 |
| Fibonacci | 87.37 | 94.51 | 98.92 | 106.07 | 113.21 | 117.62 | 124.77 |
Numerical data
The following are the details of the technical indicators and moving averages that were collected to generate this technical analysis:
| RSI (14): | 46.97 | |
| MACD (12,26,9): | 0.2700 | |
| Directional Movement: | -0.98 | |
| AROON (14): | 78.57 | |
| DEMA (21): | 83.52 | |
| Parabolic SAR (0,02-0,02-0,2): | 85.69 | |
| Elder Ray (13): | -0.64 | |
| Super Trend (3,10): | 81.71 | |
| Zig ZAG (10): | 82.90 | |
| VORTEX (21): | 1.0900 | |
| Stochastique (14,3,5): | 50.04 | |
| TEMA (21): | 84.53 | |
| Williams %R (14): | -67.86 | |
| Chande Momentum Oscillator (20): | -0.40 | |
| Repulse (5,40,3): | -0.1400 | |
| ROCnROLL: | 2 | |
| TRIX (15,9): | 0.0300 | |
| Courbe Coppock: | 5.98 |
| MA7: | 103.24 | |
| MA20: | 108.51 | |
| MA50: | 107.00 | |
| MA100: | 108.37 | |
| MAexp7: | 83.74 | |
| MAexp20: | 83.32 | |
| MAexp50: | 84.63 | |
| MAexp100: | 89.50 | |
| Price / MA7: | -19.70% | |
| Price / MA20: | -23.60% | |
| Price / MA50: | -22.52% | |
| Price / MA100: | -23.50% | |
| Price / MAexp7: | -1.00% | |
| Price / MAexp20: | -0.50% | |
| Price / MAexp50: | -2.04% | |
| Price / MAexp100: | -7.37% |
News
Don't forget to follow the news on ASTON MARTIN ORD GBP0.10. At the time of publication of this analysis, the latest news was as follows:
- METRO SUPPLY CHAIN CONTINUES PARTNERSHIP WITH ASTON MARTIN ARAMCO FORMULA ONE™ TEAM DRIVER LANCE STROLL
- ASTON MARTIN ARAMCO UNVEIL TRAILBLAZING PARTNERSHIP WITH ELEMIS, UNITING LUXURY SKINCARE WITH HIGH PERFORMANCE
- ASTON MARTIN ARAMCO FORMULA ONE® TEAM ANNOUNCE PEPPERSTONE AS OFFICAL TRADING PARTNER
- ASTON MARTIN ARAMCO FORMULA ONE® TEAM ANNOUNCE PEPPERSTONE AS OFFICAL TRADING PARTNER
- Laurie Finkelstein Reader Team Announces Record $15.25 Million Penthouse Sale at Aston Martin Residences
About author

Online


Add a comment
Comments
0 comments on the analysis ASTON MARTIN ORD GBP0.10 - 15 min.