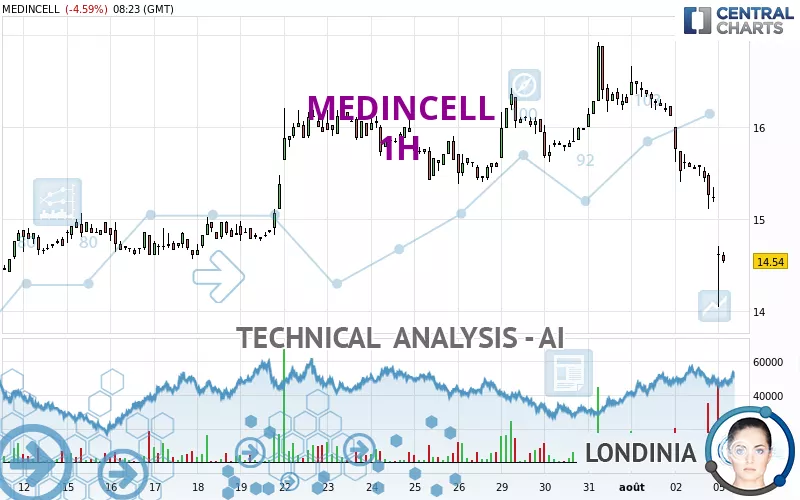
MEDINCELL - 1H - Technical analysis published on 08/05/2024 (GMT)
- 107
- 0
Click here for a new analysis!
- Timeframe : 1H
- - Analysis generated on
- Status : INVALID

Summary of the analysis

Additional analysis
Quotes
The MEDINCELL rating is 14.54 EUR. The price is lower by -4.59% since the last closing and was traded between 14.04 EUR and 14.70 EUR over the period. The price is currently at +3.56% from its lowest and -1.09% from its highest.The Central Gaps scanner detects the formation of a bearish gap marking the strong presence of sellers ahead of buyers at the opening. This formed a quotation gap.
Opening Gap DOWN
Type : Bearish
Timeframe : Openning
Here is a more detailed summary of the historical variations registered by MEDINCELL:
New LOW record (1 month)
Type : Bearish
Timeframe : Weekly
Technical
Technical analysis of this 1H chart of MEDINCELL indicates that the overall trend is strongly bearish. The signals given by moving averages are 85.71% bearish. This strong bearish trend is confirmed by the strong signals currently being given by short-term moving averages. The Central Indicators market scanner is currently detecting a bearish signal that could impact this trend:
Bearish trend reversal : Moving Average 100
Type : Bearish
Timeframe : 1 hour
In fact, according to the parameters integrated into the Central Analyzer system, 11 technical indicators out of 18 analysed are currently bearish. Caution: the Central Indicators scanner currently detects an excess:
RSI indicator is oversold : under 20
Type : Neutral
Timeframe : 1 hour
CCI indicator is oversold : under -100
Type : Neutral
Timeframe : 1 hour
Previous candle closed under Bollinger bands
Type : Neutral
Timeframe : 1 hour
CCI indicator: bullish divergence
Type : Bullish
Timeframe : 1 hour
Pivot points : price is under support 1
Type : Neutral
Timeframe : Weekly
Pivot points : price is under support 3
Type : Neutral
Timeframe : 1 hour
Central Patterns, the market scanner focusing on chart patterns, resistances and supports found this result:
Support of channel is broken
Type : Bearish
Timeframe : 1 hour
No result was found by the Central Candlesticks scanner on Japanese candlesticks.
| S3 | S2 | S1 | Price | R1 | R2 | R3 | |
|---|---|---|---|---|---|---|---|
| ProTrendLines | 10.14 | 13.02 | 14.34 | 14.54 | 14.57 | 14.77 | 15.06 |
| Change (%) | -30.26% | -10.45% | -1.38% | - | +0.21% | +1.58% | +3.58% |
| Change | -4.40 | -1.52 | -0.20 | - | +0.03 | +0.23 | +0.52 |
| Level | Major | Intermediate | Minor | - | Intermediate | Minor | Minor |
Attention could also be paid to pivot points to set price objectives:
| Pivot points | S3 | S2 | S1 | PP | R1 | R2 | R3 |
|---|---|---|---|---|---|---|---|
| Standard | 13.99 | 14.55 | 14.89 | 15.45 | 15.79 | 16.35 | 16.69 |
| Camarilla | 14.99 | 15.08 | 15.16 | 15.24 | 15.32 | 15.41 | 15.49 |
| Woodie | 13.89 | 14.50 | 14.79 | 15.40 | 15.69 | 16.30 | 16.59 |
| Fibonacci | 14.55 | 14.89 | 15.10 | 15.45 | 15.79 | 16.00 | 16.35 |
| Pivot points | S3 | S2 | S1 | PP | R1 | R2 | R3 |
|---|---|---|---|---|---|---|---|
| Standard | 12.77 | 13.93 | 14.59 | 15.75 | 16.41 | 17.57 | 18.23 |
| Camarilla | 14.74 | 14.91 | 15.07 | 15.24 | 15.41 | 15.57 | 15.74 |
| Woodie | 12.51 | 13.81 | 14.33 | 15.63 | 16.15 | 17.45 | 17.97 |
| Fibonacci | 13.93 | 14.63 | 15.06 | 15.75 | 16.45 | 16.88 | 17.57 |
| Pivot points | S3 | S2 | S1 | PP | R1 | R2 | R3 |
|---|---|---|---|---|---|---|---|
| Standard | 10.95 | 12.27 | 14.27 | 15.59 | 17.59 | 18.91 | 20.91 |
| Camarilla | 15.35 | 15.65 | 15.96 | 16.26 | 16.56 | 16.87 | 17.17 |
| Woodie | 11.28 | 12.44 | 14.60 | 15.76 | 17.92 | 19.08 | 21.24 |
| Fibonacci | 12.27 | 13.54 | 14.33 | 15.59 | 16.86 | 17.65 | 18.91 |
Numerical data
The following is the status of technical indicators and moving averages registered at the time this technical analysis was created:
| RSI (14): | 18.17 | |
| MACD (12,26,9): | -0.3300 | |
| Directional Movement: | -47.31 | |
| AROON (14): | -92.86 | |
| DEMA (21): | 15.19 | |
| Parabolic SAR (0,02-0,02-0,2): | 15.47 | |
| Elder Ray (13): | -0.78 | |
| Super Trend (3,10): | 15.25 | |
| Zig ZAG (10): | 14.52 | |
| VORTEX (21): | 0.7400 | |
| Stochastique (14,3,5): | 18.99 | |
| TEMA (21): | 14.88 | |
| Williams %R (14): | -78.76 | |
| Chande Momentum Oscillator (20): | -1.66 | |
| Repulse (5,40,3): | -0.2700 | |
| ROCnROLL: | 2 | |
| TRIX (15,9): | -0.1600 | |
| Courbe Coppock: | 14.60 |
| MA7: | 15.66 | |
| MA20: | 15.28 | |
| MA50: | 14.87 | |
| MA100: | 13.33 | |
| MAexp7: | 15.07 | |
| MAexp20: | 15.55 | |
| MAexp50: | 15.78 | |
| MAexp100: | 15.67 | |
| Price / MA7: | -7.15% | |
| Price / MA20: | -4.84% | |
| Price / MA50: | -2.22% | |
| Price / MA100: | +9.08% | |
| Price / MAexp7: | -3.52% | |
| Price / MAexp20: | -6.50% | |
| Price / MAexp50: | -7.86% | |
| Price / MAexp100: | -7.21% |
News
The last news published on MEDINCELL at the time of the generation of this analysis was as follows:
- MedinCell and the European Investment Bank (EIB) Have Replaced a Financial Covenant of Their Ongoing Loan Agreement to Better Fit with MedinCell Business Model
- MedinCell: Participation Terms in the Combined General Meeting
- MedinCell’s Partner Teva Announces Successful Launch of UZEDY™
- MedinCell’s Partner Teva Announces Successful Launch of UZEDY™
- MedinCell has Received the Last Tranche of €10m from the European Investment Bank (EIB) Loan
About author

Online


Add a comment
Comments
0 comments on the analysis MEDINCELL - 1H