BIOSYNEX - Daily - Technical analysis published on 08/19/2024 (GMT)
- 105
- 0
Click here for a new analysis!
- Timeframe : Daily
- - Analysis generated on
- Status : INVALID
Summary of the analysis

Additional analysis
Quotes
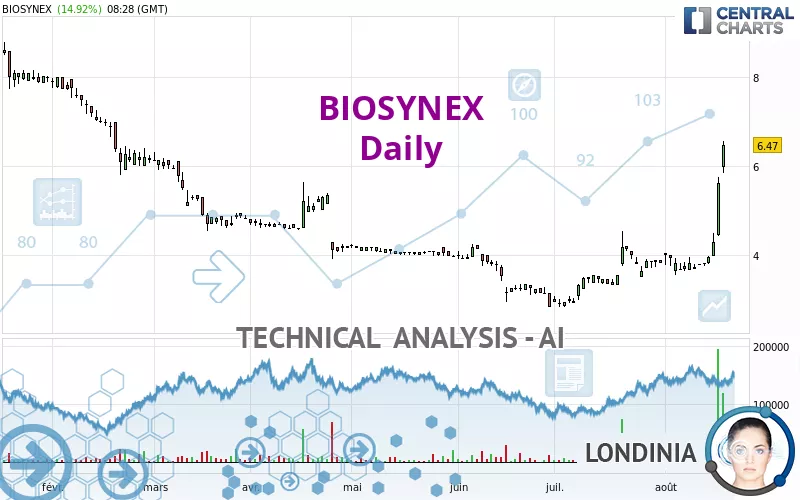
The BIOSYNEX rating is 6.47 EUR. The price registered an increase of +14.92% on the session and was between 5.84 EUR and 6.57 EUR. This implies that the price is at +10.79% from its lowest and at -1.52% from its highest.The Central Gaps scanner detects a bullish gap which is a sign that buyers have taken the lead in the very short term.
Opening Gap UP
Type : Bullish
Timeframe : Openning
A study of price movements over other periods shows the following variations:
New HIGH record (1 month)
Type : Bullish
Timeframe : Weekly
The Central Volumes scanner notes the presence of abnormal volumes:
Abnormal volumes
Timeframe : 5 days
Abnormal volumes
Timeframe : 20 days
Abnormal volumes
Timeframe : 50 days
Technical
Technical analysis of BIOSYNEX in Daily shows a strongly overall bullish trend. 82.14% of the signals given by moving averages are bullish. The overall trend is supported by the strong bullish signals from short-term moving averages. The Central Indicators scanner detects bullish signals on moving averages that could impact this trend:
Bullish trend reversal : Moving Average 100
Type : Bullish
Timeframe : Daily
Moving Average bullish crossovers : AMA50 & AMA100
Type : Bullish
Timeframe : Daily
In fact, according to the parameters integrated into the Central Analyzer system, 17 technical indicators out of 18 analysed are currently bullish. Caution: the Central Indicators scanner currently detects an excess:
RSI indicator is overbought : over 80
Type : Neutral
Timeframe : Daily
CCI indicator is overbought : over 100
Type : Neutral
Timeframe : Daily
Previous candle closed over Bollinger bands
Type : Neutral
Timeframe : Daily
Williams %R indicator is overbought : over -20
Type : Neutral
Timeframe : Daily
Pivot points : price is over resistance 1
Type : Neutral
Timeframe : Daily
Pivot points : price is over resistance 1
Type : Neutral
Timeframe : Weekly
The Central Patterns scanner, which studies chart patterns, resistances and supports, has identified these signals:
Horizontal resistance is broken
Type : Bullish
Timeframe : Daily
Resistance of channel is broken
Type : Bullish
Timeframe : Daily
The presence of a bullish Japanese candlestick pattern detected by Central Candlesticks that could cause a very short term rebound was also detected:
Upside gap
Type : Bullish
Timeframe : Daily
| S3 | S2 | S1 | Price | R1 | R2 | R3 | |
|---|---|---|---|---|---|---|---|
| ProTrendLines | 4.62 | 5.36 | 6.11 | 6.47 | 6.87 | 7.59 | 8.16 |
| Change (%) | -28.59% | -17.16% | -5.52% | - | +6.11% | +17.31% | +26.12% |
| Change | -1.85 | -1.11 | -0.36 | - | +0.40 | +1.12 | +1.69 |
| Level | Minor | Intermediate | Minor | - | Minor | Minor | Major |
Attention could also be paid to pivot points to set price objectives:
| Pivot points | S3 | S2 | S1 | PP | R1 | R2 | R3 |
|---|---|---|---|---|---|---|---|
| Standard | 3.47 | 3.95 | 4.79 | 5.27 | 6.11 | 6.59 | 7.43 |
| Camarilla | 5.27 | 5.39 | 5.51 | 5.63 | 5.75 | 5.87 | 5.99 |
| Woodie | 3.65 | 4.04 | 4.97 | 5.36 | 6.29 | 6.68 | 7.61 |
| Fibonacci | 3.95 | 4.45 | 4.77 | 5.27 | 5.77 | 6.09 | 6.59 |
| Pivot points | S3 | S2 | S1 | PP | R1 | R2 | R3 |
|---|---|---|---|---|---|---|---|
| Standard | 2.34 | 3.04 | 4.34 | 5.04 | 6.34 | 7.04 | 8.34 |
| Camarilla | 5.08 | 5.26 | 5.45 | 5.63 | 5.81 | 6.00 | 6.18 |
| Woodie | 2.63 | 3.19 | 4.63 | 5.19 | 6.63 | 7.19 | 8.63 |
| Fibonacci | 3.04 | 3.81 | 4.28 | 5.04 | 5.81 | 6.28 | 7.04 |
| Pivot points | S3 | S2 | S1 | PP | R1 | R2 | R3 |
|---|---|---|---|---|---|---|---|
| Standard | 1.22 | 2.02 | 2.93 | 3.73 | 4.64 | 5.44 | 6.35 |
| Camarilla | 3.36 | 3.52 | 3.67 | 3.83 | 3.99 | 4.14 | 4.30 |
| Woodie | 1.27 | 2.05 | 2.98 | 3.76 | 4.69 | 5.47 | 6.40 |
| Fibonacci | 2.02 | 2.68 | 3.08 | 3.73 | 4.39 | 4.79 | 5.44 |
Numerical data
The following is the status of technical indicators and moving averages registered at the time this technical analysis was created:
| RSI (14): | 85.81 | |
| MACD (12,26,9): | 0.4000 | |
| Directional Movement: | 53.56 | |
| AROON (14): | 71.43 | |
| DEMA (21): | 4.67 | |
| Parabolic SAR (0,02-0,02-0,2): | 3.61 | |
| Elder Ray (13): | 1.74 | |
| Super Trend (3,10): | 4.98 | |
| Zig ZAG (10): | 6.50 | |
| VORTEX (21): | 1.2400 | |
| Stochastique (14,3,5): | 90.49 | |
| TEMA (21): | 5.01 | |
| Williams %R (14): | -2.98 | |
| Chande Momentum Oscillator (20): | 2.45 | |
| Repulse (5,40,3): | 33.9400 | |
| ROCnROLL: | 1 | |
| TRIX (15,9): | 0.6800 | |
| Courbe Coppock: | 41.11 |
| MA7: | 4.53 | |
| MA20: | 4.08 | |
| MA50: | 3.65 | |
| MA100: | 4.01 | |
| MAexp7: | 4.90 | |
| MAexp20: | 4.23 | |
| MAexp50: | 3.97 | |
| MAexp100: | 4.36 | |
| Price / MA7: | +42.83% | |
| Price / MA20: | +58.58% | |
| Price / MA50: | +77.26% | |
| Price / MA100: | +61.35% | |
| Price / MAexp7: | +32.04% | |
| Price / MAexp20: | +52.96% | |
| Price / MAexp50: | +62.97% | |
| Price / MAexp100: | +48.39% |
News
The last news published on BIOSYNEX at the time of the generation of this analysis was as follows:
- Shareholder Alert: Ademi LLP investigates whether Chembio Diagnostics, Inc. has obtained a Fair Price in its transaction with Biosynex
- BIOSYNEX SA: Extension of the distribution agreement between Credo Diagnostics Biomedical Pte Ltd and BIOSYNEX S.A.
- BIOSYNEX Announces the Great Success of Its Capital Increase Through Placement With Qualified Investors for an Amount of €15m
-
 Biosynex
About author

Online


Add a comment
Comments
0 comments on the analysis BIOSYNEX - Daily