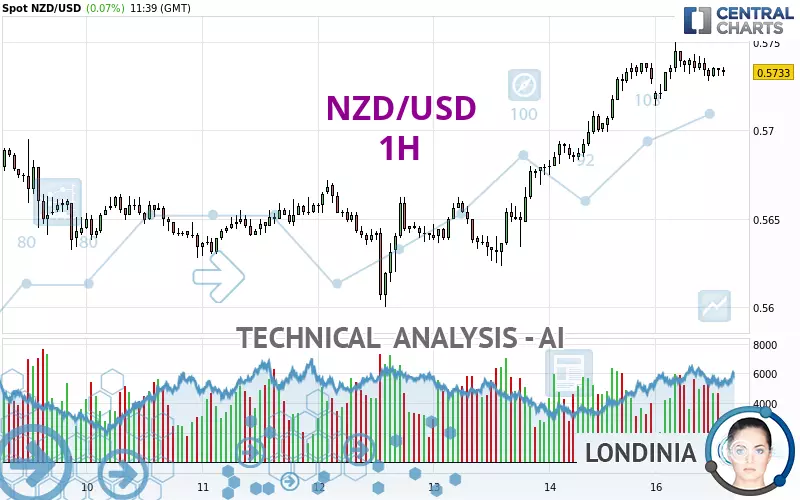
NZD/USD - 1H - Technical analysis published on 02/17/2025 (GMT)
- 217
- 0
Click here for a new analysis!
- Timeframe : 1H
- - Analysis generated on
- Status : TARGET REACHED

Summary of the analysis

Additional analysis
Quotes
The NZD/USD price is 0.5732 USD. The price has increased by +0.05% since the last closing and was between 0.5714 USD and 0.5750 USD. This implies that the price is at +0.32% from its lowest and at -0.31% from its highest.The Central Gaps scanner detects a bearish opening marking the presence of sellers ahead of buyers at the opening but not sufficiently marked to allow the price to register a quotation gap.
Bearish opening
Type : Bearish
Timeframe : Openning
Here is a more detailed summary of the historical variations registered by NZD/USD:
Near a new LOW record (5 years)
Type : Bearish
Timeframe : Weekly
Near a new LOW record (1 year)
Type : Bearish
Timeframe : Weekly
New HIGH record (1st january)
Type : Bullish
Timeframe : Weekly
New HIGH record (1 month)
Type : Bullish
Timeframe : Weekly
Technical
Technical analysis of this 1H chart of NZD/USD indicates that the overall trend is strongly bullish. 85.71% of the signals given by moving averages are bullish. The slightly bullish signals given by the short-term moving averages show a weakening of the global trend. There is no crossing of moving average by the price or crossing of moving averages between themselves.
In fact, only 8 technical indicators out of 18 studied are currently positioned bullish. The Central Indicators scanner specialised in technical indicators, has not detected anything further.
Central Patterns, the market scanner focusing on chart patterns, resistances and supports found this result:
Near resistance of channel
Type : Bearish
Timeframe : 1 hour
The Central Candlesticks scanner currently notes the presence of this pattern in Japanese candlesticks that could mark the end of the short-term trend currently underway:
Doji
Type : Neutral
Timeframe : 1 hour
| S3 | S2 | S1 | Price | R1 | R2 | R3 | |
|---|---|---|---|---|---|---|---|
| ProTrendLines | 0.5632 | 0.5662 | 0.5687 | 0.5732 | 0.5738 | 0.5876 | 0.6103 |
| Change (%) | -1.74% | -1.22% | -0.79% | - | +0.10% | +2.51% | +6.47% |
| Change | -0.0100 | -0.0070 | -0.0045 | - | +0.0006 | +0.0144 | +0.0371 |
| Level | Minor | Intermediate | Major | - | Intermediate | Major | Intermediate |
Pivot points can also be used to set your price objectives. Here is the price situation in relation to pivot points:
| Pivot points | S3 | S2 | S1 | PP | R1 | R2 | R3 |
|---|---|---|---|---|---|---|---|
| Standard | 0.5627 | 0.5651 | 0.5690 | 0.5714 | 0.5753 | 0.5777 | 0.5816 |
| Camarilla | 0.5712 | 0.5718 | 0.5723 | 0.5729 | 0.5735 | 0.5741 | 0.5746 |
| Woodie | 0.5635 | 0.5655 | 0.5698 | 0.5718 | 0.5761 | 0.5781 | 0.5824 |
| Fibonacci | 0.5651 | 0.5675 | 0.5690 | 0.5714 | 0.5738 | 0.5753 | 0.5777 |
| Pivot points | S3 | S2 | S1 | PP | R1 | R2 | R3 |
|---|---|---|---|---|---|---|---|
| Standard | 0.5502 | 0.5551 | 0.5640 | 0.5689 | 0.5778 | 0.5827 | 0.5916 |
| Camarilla | 0.5691 | 0.5704 | 0.5716 | 0.5729 | 0.5742 | 0.5754 | 0.5767 |
| Woodie | 0.5522 | 0.5561 | 0.5660 | 0.5699 | 0.5798 | 0.5837 | 0.5936 |
| Fibonacci | 0.5551 | 0.5604 | 0.5636 | 0.5689 | 0.5742 | 0.5774 | 0.5827 |
| Pivot points | S3 | S2 | S1 | PP | R1 | R2 | R3 |
|---|---|---|---|---|---|---|---|
| Standard | 0.5366 | 0.5453 | 0.5548 | 0.5635 | 0.5730 | 0.5817 | 0.5912 |
| Camarilla | 0.5592 | 0.5609 | 0.5625 | 0.5642 | 0.5659 | 0.5675 | 0.5692 |
| Woodie | 0.5369 | 0.5455 | 0.5551 | 0.5637 | 0.5733 | 0.5819 | 0.5915 |
| Fibonacci | 0.5453 | 0.5523 | 0.5566 | 0.5635 | 0.5705 | 0.5748 | 0.5817 |
Numerical data
The following is the status of technical indicators and moving averages registered at the time this technical analysis was created:
| RSI (14): | 59.44 | |
| MACD (12,26,9): | 0.0008 | |
| Directional Movement: | 12.3818 | |
| AROON (14): | 28.5714 | |
| DEMA (21): | 0.5743 | |
| Parabolic SAR (0,02-0,02-0,2): | 0.5726 | |
| Elder Ray (13): | 0.0001 | |
| Super Trend (3,10): | 0.5710 | |
| Zig ZAG (10): | 0.5735 | |
| VORTEX (21): | 1.0615 | |
| Stochastique (14,3,5): | 55.67 | |
| TEMA (21): | 0.5738 | |
| Williams %R (14): | -46.88 | |
| Chande Momentum Oscillator (20): | 0.0001 | |
| Repulse (5,40,3): | 0.0096 | |
| ROCnROLL: | -1 | |
| TRIX (15,9): | 0.0283 | |
| Courbe Coppock: | 0.14 |
| MA7: | 0.5676 | |
| MA20: | 0.5667 | |
| MA50: | 0.5667 | |
| MA100: | 0.5833 | |
| MAexp7: | 0.5734 | |
| MAexp20: | 0.5730 | |
| MAexp50: | 0.5709 | |
| MAexp100: | 0.5687 | |
| Price / MA7: | +0.99% | |
| Price / MA20: | +1.15% | |
| Price / MA50: | +1.15% | |
| Price / MA100: | -1.73% | |
| Price / MAexp7: | -0.02% | |
| Price / MAexp20: | +0.05% | |
| Price / MAexp50: | +0.42% | |
| Price / MAexp100: | +0.81% |
News
Don't forget to follow the news on NZD/USD. At the time of publication of this analysis, the latest news was as follows:
-
 NZD/USD Analysis: Can the Kiwi Recover?
-
NZD/USD Price Analysis: Can the Kiwi Go Higher at this Point?
-
NZD/USD Forecast December 10, 2024
-
NZD/USD Forecast December 9, 2024
-
NZD/USD Forecast December 6, 2024
About author

Online


Add a comment
Comments
0 comments on the analysis NZD/USD - 1H