NZD/USD - 1H - Technical analysis published on 01/13/2025 (GMT)
- 148
- 0
Click here for a new analysis!
- Timeframe : 1H
- - Analysis generated on
- Status : TARGET REACHED

Summary of the analysis

Additional analysis
Quotes
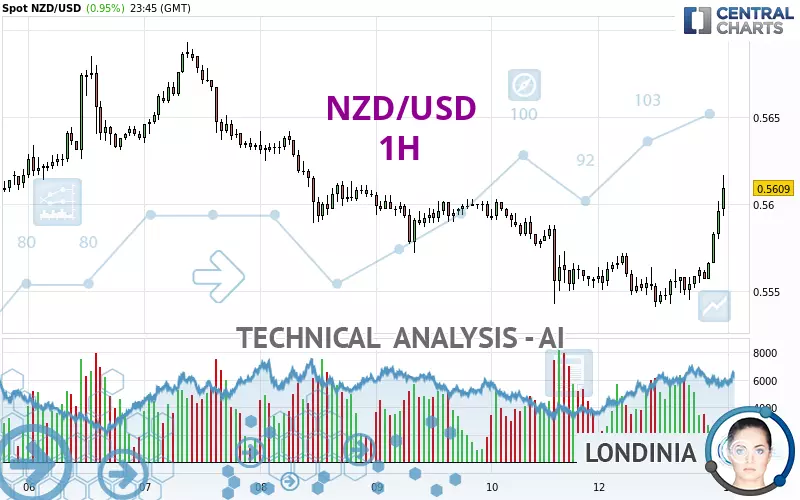
The NZD/USD rating is 0.5609 USD. The price has increased by +0.95% since the last closing with the lowest point at 0.5541 USD and the highest point at 0.5617 USD. The deviation from the price is +1.23% for the low point and -0.14% for the high point.The Central Gaps scanner detects a bullish opening marking the presence of buyers ahead of sellers at the opening but not sufficiently marked to allow the price to register a quotation gap.
Bullish opening
Type : Bullish
Timeframe : Openning
So that you have an overall view of the price change, here is a table showing the variations over several periods:
Near a new LOW record (5 years)
Type : Bearish
Timeframe : Weekly
New LOW record (1 year)
Type : Bearish
Timeframe : Weekly
Near a new HIGH record (1st january)
Type : Bullish
Timeframe : Weekly
New LOW record (1st january)
Type : Bearish
Timeframe : Weekly
Near a new HIGH record (1 month)
Type : Bullish
Timeframe : Weekly
New LOW record (1 month)
Type : Bearish
Timeframe : Weekly
Technical
Technical analysis of NZD/USD in 1H shows an overall slightly bullish trend. Only 60.71% of the signals given by moving averages are bullish. This slightly bullish trend is reinforced by the strong signals currently being given by short-term moving averages. The Central Indicators market scanner is currently detecting several bullish signals that could impact this trend:
Bullish trend reversal : adaptative moving average 100
Type : Bullish
Timeframe : 1 hour
Moving Average bullish crossovers : AMA20 & AMA50
Type : Bullish
Timeframe : 1 hour
In fact, 16 technical indicators on 18 studied are currently positioned bullish. But beware of excesses. The Central Indicators scanner currently detects this:
RSI indicator is overbought : over 70
Type : Neutral
Timeframe : 1 hour
CCI indicator is overbought : over 100
Type : Neutral
Timeframe : 1 hour
Previous candle closed over Bollinger bands
Type : Neutral
Timeframe : 1 hour
Williams %R indicator is overbought : over -20
Type : Neutral
Timeframe : 1 hour
Pivot points : price is over resistance 1
Type : Neutral
Timeframe : 1 hour
Price is back over the pivot point
Type : Bullish
Timeframe : Weekly
Central Patterns, the market scanner focusing on chart patterns, resistances and supports found these results:
Near horizontal resistance
Type : Bearish
Timeframe : 1 hour
Resistance of channel is broken
Type : Bullish
Timeframe : 1 hour
The Central Candlesticks scanner which studies Japanese candlesticks did not detect anything.
| S3 | S2 | S1 | Price | R1 | R2 | R3 | |
|---|---|---|---|---|---|---|---|
| ProTrendLines | 0.5543 | 0.5562 | 0.5588 | 0.5609 | 0.5625 | 0.5642 | 0.5693 |
| Change (%) | -1.18% | -0.84% | -0.37% | - | +0.29% | +0.59% | +1.50% |
| Change | -0.0066 | -0.0047 | -0.0021 | - | +0.0016 | +0.0033 | +0.0084 |
| Level | Intermediate | Major | Major | - | Minor | Minor | Minor |
Pivot points can also be used to set your price objectives. Here is the price situation in relation to pivot points:
| Pivot points | S3 | S2 | S1 | PP | R1 | R2 | R3 |
|---|---|---|---|---|---|---|---|
| Standard | 0.5472 | 0.5507 | 0.5532 | 0.5567 | 0.5592 | 0.5627 | 0.5652 |
| Camarilla | 0.5540 | 0.5545 | 0.5551 | 0.5556 | 0.5562 | 0.5567 | 0.5573 |
| Woodie | 0.5466 | 0.5505 | 0.5526 | 0.5565 | 0.5586 | 0.5625 | 0.5646 |
| Fibonacci | 0.5507 | 0.5530 | 0.5544 | 0.5567 | 0.5590 | 0.5604 | 0.5627 |
| Pivot points | S3 | S2 | S1 | PP | R1 | R2 | R3 |
|---|---|---|---|---|---|---|---|
| Standard | 0.5352 | 0.5447 | 0.5502 | 0.5597 | 0.5652 | 0.5747 | 0.5802 |
| Camarilla | 0.5515 | 0.5529 | 0.5542 | 0.5556 | 0.5570 | 0.5584 | 0.5597 |
| Woodie | 0.5331 | 0.5437 | 0.5481 | 0.5587 | 0.5631 | 0.5737 | 0.5781 |
| Fibonacci | 0.5447 | 0.5505 | 0.5540 | 0.5597 | 0.5655 | 0.5690 | 0.5747 |
| Pivot points | S3 | S2 | S1 | PP | R1 | R2 | R3 |
|---|---|---|---|---|---|---|---|
| Standard | 0.5146 | 0.5367 | 0.5480 | 0.5701 | 0.5814 | 0.6035 | 0.6148 |
| Camarilla | 0.5502 | 0.5533 | 0.5563 | 0.5594 | 0.5625 | 0.5655 | 0.5686 |
| Woodie | 0.5093 | 0.5340 | 0.5427 | 0.5674 | 0.5761 | 0.6008 | 0.6095 |
| Fibonacci | 0.5367 | 0.5494 | 0.5573 | 0.5701 | 0.5828 | 0.5907 | 0.6035 |
Numerical data
The following is the status of technical indicators and moving averages registered at the time this technical analysis was created:
| RSI (14): | 73.16 | |
| MACD (12,26,9): | 0.0006 | |
| Directional Movement: | 22.8018 | |
| AROON (14): | 100.0000 | |
| DEMA (21): | 0.5572 | |
| Parabolic SAR (0,02-0,02-0,2): | 0.5550 | |
| Elder Ray (13): | 0.0027 | |
| Super Trend (3,10): | 0.5564 | |
| Zig ZAG (10): | 0.5605 | |
| VORTEX (21): | 1.1191 | |
| Stochastique (14,3,5): | 95.95 | |
| TEMA (21): | 0.5583 | |
| Williams %R (14): | 0.00 | |
| Chande Momentum Oscillator (20): | 0.0058 | |
| Repulse (5,40,3): | 0.6890 | |
| ROCnROLL: | 1 | |
| TRIX (15,9): | -0.0020 | |
| Courbe Coppock: | 0.92 |
| MA7: | 0.5607 | |
| MA20: | 0.5641 | |
| MA50: | 0.5790 | |
| MA100: | 0.5974 | |
| MAexp7: | 0.5582 | |
| MAexp20: | 0.5568 | |
| MAexp50: | 0.5571 | |
| MAexp100: | 0.5585 | |
| Price / MA7: | +0.04% | |
| Price / MA20: | -0.57% | |
| Price / MA50: | -3.13% | |
| Price / MA100: | -6.11% | |
| Price / MAexp7: | +0.48% | |
| Price / MAexp20: | +0.74% | |
| Price / MAexp50: | +0.68% | |
| Price / MAexp100: | +0.43% |
News
Don't forget to follow the news on NZD/USD. At the time of publication of this analysis, the latest news was as follows:
-
 NZD/USD Forecast December 10, 2024
-
NZD/USD Forecast December 9, 2024
-
NZD/USD Forecast December 6, 2024
-
NZD/USD Forecast November 22, 2024
-
NZD/USD Forecast November 19, 2024
About author

Online


Add a comment
Comments
0 comments on the analysis NZD/USD - 1H