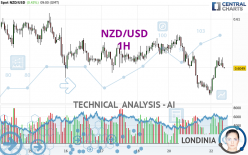
NZD/USD - 1H - Technical analysis published on 10/22/2024 (GMT)
- 69
- 0
Click here for a new analysis!
- Timeframe : 1H
- - Analysis generated on
- Status : LEVEL MAINTAINED

Summary of the analysis

Additional analysis
Quotes
The NZD/USD rating is 0.6049 USD. The price has increased by +0.43% since the last closing and was between 0.6021 USD and 0.6060 USD. This implies that the price is at +0.47% from its lowest and at -0.18% from its highest.A study of price movements over other periods shows the following variations:
Near a new LOW record (1 year)
Type : Bearish
Timeframe : Weekly
Near a new LOW record (1st january)
Type : Bearish
Timeframe : Weekly
New LOW record (1 month)
Type : Bearish
Timeframe : Weekly
Technical
A technical analysis in 1H of this NZD/USD chart shows a bearish trend. The signals given by moving averages are 64.29% bearish. This bearish trend could slow down given the neutral signals currently being given by short-term moving averages. The Central Indicators scanner does not detect any result on moving averages that would impact this trend.
An assessment of technical indicators shows a strong bullish signal.
Caution: the Central Indicators scanner currently detects an excess:
RSI indicator: bearish divergence
Type : Bearish
Timeframe : 1 hour
Williams %R indicator is overbought : over -20
Type : Neutral
Timeframe : 1 hour
Price is back under the pivot point
Type : Bearish
Timeframe : Weekly
No signals are given by Central Patterns, a market scanner specialised in chart patterns, resistances and supports.
The Central Candlesticks scanner which studies Japanese candlesticks did not detect anything.
| S3 | S2 | S1 | Price | R1 | R2 | R3 | |
|---|---|---|---|---|---|---|---|
| ProTrendLines | 0.5877 | 0.5980 | 0.6027 | 0.6049 | 0.6052 | 0.6065 | 0.6084 |
| Change (%) | -2.84% | -1.14% | -0.36% | - | +0.05% | +0.26% | +0.58% |
| Change | -0.0172 | -0.0069 | -0.0022 | - | +0.0003 | +0.0016 | +0.0035 |
| Level | Major | Minor | Minor | - | Intermediate | Major | Intermediate |
Pivot points can also be used to set your price objectives. Here is the price situation in relation to pivot points:
| Pivot points | S3 | S2 | S1 | PP | R1 | R2 | R3 |
|---|---|---|---|---|---|---|---|
| Standard | 0.5938 | 0.5980 | 0.6001 | 0.6043 | 0.6064 | 0.6106 | 0.6127 |
| Camarilla | 0.6006 | 0.6012 | 0.6017 | 0.6023 | 0.6029 | 0.6035 | 0.6040 |
| Woodie | 0.5929 | 0.5975 | 0.5992 | 0.6038 | 0.6055 | 0.6101 | 0.6118 |
| Fibonacci | 0.5980 | 0.6004 | 0.6019 | 0.6043 | 0.6067 | 0.6082 | 0.6106 |
| Pivot points | S3 | S2 | S1 | PP | R1 | R2 | R3 |
|---|---|---|---|---|---|---|---|
| Standard | 0.5971 | 0.6005 | 0.6038 | 0.6072 | 0.6105 | 0.6139 | 0.6172 |
| Camarilla | 0.6053 | 0.6059 | 0.6065 | 0.6071 | 0.6077 | 0.6083 | 0.6089 |
| Woodie | 0.5971 | 0.6005 | 0.6038 | 0.6072 | 0.6105 | 0.6139 | 0.6172 |
| Fibonacci | 0.6005 | 0.6031 | 0.6046 | 0.6072 | 0.6098 | 0.6113 | 0.6139 |
| Pivot points | S3 | S2 | S1 | PP | R1 | R2 | R3 |
|---|---|---|---|---|---|---|---|
| Standard | 0.5901 | 0.6004 | 0.6174 | 0.6277 | 0.6447 | 0.6550 | 0.6720 |
| Camarilla | 0.6270 | 0.6295 | 0.6320 | 0.6345 | 0.6370 | 0.6395 | 0.6420 |
| Woodie | 0.5936 | 0.6021 | 0.6209 | 0.6294 | 0.6482 | 0.6567 | 0.6755 |
| Fibonacci | 0.6004 | 0.6108 | 0.6172 | 0.6277 | 0.6381 | 0.6445 | 0.6550 |
Numerical data
The following are the details of the technical indicators and moving averages that were collected to generate this technical analysis:
| RSI (14): | 58.55 | |
| MACD (12,26,9): | -0.0002 | |
| Directional Movement: | 9.7924 | |
| AROON (14): | 42.8571 | |
| DEMA (21): | 0.6041 | |
| Parabolic SAR (0,02-0,02-0,2): | 0.6030 | |
| Elder Ray (13): | 0.0010 | |
| Super Trend (3,10): | 0.6030 | |
| Zig ZAG (10): | 0.6058 | |
| VORTEX (21): | 1.0000 | |
| Stochastique (14,3,5): | 92.31 | |
| TEMA (21): | 0.6044 | |
| Williams %R (14): | -2.56 | |
| Chande Momentum Oscillator (20): | 0.0029 | |
| Repulse (5,40,3): | 0.2560 | |
| ROCnROLL: | 1 | |
| TRIX (15,9): | -0.0162 | |
| Courbe Coppock: | 0.12 |
| MA7: | 0.6059 | |
| MA20: | 0.6156 | |
| MA50: | 0.6173 | |
| MA100: | 0.6117 | |
| MAexp7: | 0.6048 | |
| MAexp20: | 0.6045 | |
| MAexp50: | 0.6053 | |
| MAexp100: | 0.6060 | |
| Price / MA7: | -0.17% | |
| Price / MA20: | -1.74% | |
| Price / MA50: | -2.01% | |
| Price / MA100: | -1.11% | |
| Price / MAexp7: | +0.02% | |
| Price / MAexp20: | +0.07% | |
| Price / MAexp50: | -0.07% | |
| Price / MAexp100: | -0.18% |
News
Don't forget to follow the news on NZD/USD. At the time of publication of this analysis, the latest news was as follows:
-
 NZD/USD Forecast October 22, 2024
-
NZD/USD Forecast October 21, 2024
-
NZD/USD Forecast October 18, 2024
-
NZD/USD Forecast October 10, 2024
-
Weekly Technical Outlook on USDJPY, NZDUSD, Oil
About author

Online


Add a comment
Comments
0 comments on the analysis NZD/USD - 1H