| Open: | 0.5735 |
| Change: | -0.0018 |
| Volume: | 67,106 |
| Low: | 0.5711 |
| High: | 0.5736 |
| High / Low range: | 0.0025 |
| Type: | Forex |
| Ticker: | NZDUSD |
| ISIN: |
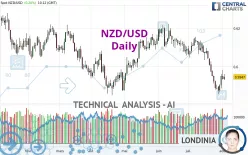
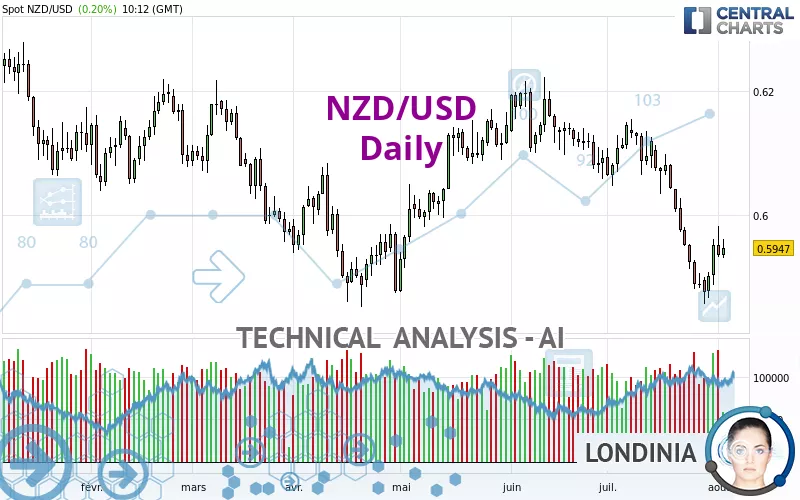
NZD/USD - Daily - Technical analysis published on 08/02/2024 (GMT)
- 138
- 0
- 08/02/2024 - 10:12
Click here for a new analysis!
- Timeframe : Daily
- - Analysis generated on 08/02/2024 - 10:12
- Status : INVALID
Summary of the analysis

Additional analysis
Quotes
The NZD/USD rating is 0.5947 USD. On the day, this instrument gained +0.20% with the lowest point at 0.5930 USD and the highest point at 0.5961 USD. The deviation from the price is +0.29% for the low point and -0.23% for the high point.A study of price movements over other periods shows the following variations:
Near a new LOW record (1 year)
Type : Bearish
Timeframe : Weekly
Near a new LOW record (1st january)
Type : Bearish
Timeframe : Weekly
Near a new HIGH record (1 month)
Type : Bullish
Timeframe : Weekly
Technical
A technical analysis in Daily of this NZD/USD chart shows a sharp bearish trend. 89.29% of the signals given by moving averages are bearish. The overall trend is supported by the strong bearish signals from short-term moving averages. There is no crossing of moving average by the price or crossing of moving averages between themselves.
On the 18 technical indicators analysed, 5 are bullish, 5 are neutral and 8 are bearish. Other results related to technical indicators were also found by the Central Indicators scanner:
Price is back over the pivot point
Type : Bullish
Timeframe : Daily
Price is back over the pivot point
Type : Bullish
Timeframe : Weekly
An analysis of the price chart with the Central Patterns scanner (detector of chart patterns and resistances and supports) shows a result that can have an impact on the price change:
Near support of triangle
Type : Bullish
Timeframe : Daily
No result was found by the Central Candlesticks scanner on Japanese candlesticks.
| S3 | S2 | S1 | Price | R1 | R2 | R3 | |
|---|---|---|---|---|---|---|---|
| ProTrendLines | 0.5562 | 0.5792 | 0.5878 | 0.5947 | 0.5993 | 0.6064 | 0.6197 |
| Change (%) | -6.47% | -2.61% | -1.16% | - | +0.77% | +1.97% | +4.20% |
| Change | -0.0385 | -0.0155 | -0.0069 | - | +0.0046 | +0.0117 | +0.0250 |
| Level | Minor | Major | Major | - | Minor | Intermediate | Major |
Pivot points can also be used to set your price objectives. Here is the price situation in relation to pivot points:
| Pivot points | S3 | S2 | S1 | PP | R1 | R2 | R3 |
|---|---|---|---|---|---|---|---|
| Standard | 0.5868 | 0.5900 | 0.5918 | 0.5950 | 0.5968 | 0.6000 | 0.6018 |
| Camarilla | 0.5921 | 0.5926 | 0.5930 | 0.5935 | 0.5940 | 0.5944 | 0.5949 |
| Woodie | 0.5860 | 0.5897 | 0.5910 | 0.5947 | 0.5960 | 0.5997 | 0.6010 |
| Fibonacci | 0.5900 | 0.5919 | 0.5931 | 0.5950 | 0.5969 | 0.5981 | 0.6000 |
| Pivot points | S3 | S2 | S1 | PP | R1 | R2 | R3 |
|---|---|---|---|---|---|---|---|
| Standard | 0.5690 | 0.5785 | 0.5837 | 0.5932 | 0.5984 | 0.6079 | 0.6131 |
| Camarilla | 0.5848 | 0.5861 | 0.5875 | 0.5888 | 0.5902 | 0.5915 | 0.5928 |
| Woodie | 0.5668 | 0.5774 | 0.5815 | 0.5921 | 0.5962 | 0.6068 | 0.6109 |
| Fibonacci | 0.5785 | 0.5842 | 0.5876 | 0.5932 | 0.5989 | 0.6023 | 0.6079 |
| Pivot points | S3 | S2 | S1 | PP | R1 | R2 | R3 |
|---|---|---|---|---|---|---|---|
| Standard | 0.5524 | 0.5690 | 0.5821 | 0.5987 | 0.6118 | 0.6284 | 0.6415 |
| Camarilla | 0.5869 | 0.5897 | 0.5924 | 0.5951 | 0.5978 | 0.6006 | 0.6033 |
| Woodie | 0.5506 | 0.5681 | 0.5803 | 0.5978 | 0.6100 | 0.6275 | 0.6397 |
| Fibonacci | 0.5690 | 0.5804 | 0.5874 | 0.5987 | 0.6101 | 0.6171 | 0.6284 |
Numerical data
The following is the status of technical indicators and moving averages registered at the time this technical analysis was created:
| RSI (14): | 40.71 | |
| MACD (12,26,9): | -0.0048 | |
| Directional Movement: | -10.6848 | |
| AROON (14): | -71.4286 | |
| DEMA (21): | 0.5924 | |
| Parabolic SAR (0,02-0,02-0,2): | 0.5860 | |
| Elder Ray (13): | -0.0013 | |
| Super Trend (3,10): | 0.6001 | |
| Zig ZAG (10): | 0.5950 | |
| VORTEX (21): | 0.7976 | |
| Stochastique (14,3,5): | 34.81 | |
| TEMA (21): | 0.5894 | |
| Williams %R (14): | -61.00 | |
| Chande Momentum Oscillator (20): | -0.0130 | |
| Repulse (5,40,3): | 0.2474 | |
| ROCnROLL: | 2 | |
| TRIX (15,9): | -0.1096 | |
| Courbe Coppock: | 5.65 |
| MA7: | 0.5913 | |
| MA20: | 0.6004 | |
| MA50: | 0.6080 | |
| MA100: | 0.6042 | |
| MAexp7: | 0.5935 | |
| MAexp20: | 0.5985 | |
| MAexp50: | 0.6037 | |
| MAexp100: | 0.6052 | |
| Price / MA7: | +0.58% | |
| Price / MA20: | -0.95% | |
| Price / MA50: | -2.19% | |
| Price / MA100: | -1.57% | |
| Price / MAexp7: | +0.20% | |
| Price / MAexp20: | -0.63% | |
| Price / MAexp50: | -1.49% | |
| Price / MAexp100: | -1.73% |
News
The latest news and videos published on NZD/USD at the time of the analysis were as follows:
-
08/01/2024 - 16:21
 NZD/USD Forecast August 2, 2024
-
07/31/2024 - 16:21
NZD/USD Forecast August 1, 2024
-
07/22/2024 - 17:38
NZD/USD Forecast July 23, 2024
-
07/16/2024 - 15:28
NZD/USD Forecast July 17, 2024
-
07/15/2024 - 18:14
NZD/USD Forecast July 16, 2024
About author

Online


Add a comment
Comments
0 comments on the analysis NZD/USD - Daily