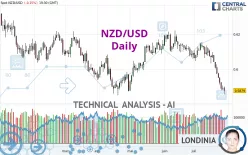
NZD/USD - Daily - Technical analysis published on 07/29/2024 (GMT)
- 162
- 0
Click here for a new analysis!
- Timeframe : Daily
- - Analysis generated on
- Status : INVALID

Summary of the analysis

Additional analysis
Quotes
NZD/USD rating 0.5879 USD. The price is lower by -0.15% since the last closing and was traded between 0.5857 USD and 0.5901 USD over the period. The price is currently at +0.38% from its lowest and -0.37% from its highest.The Central Gaps scanner detects a bullish opening marking the presence of buyers ahead of sellers at the opening but not sufficiently marked to allow the price to register a quotation gap.
Bullish opening
Type : Bullish
Timeframe : Openning
Here is a more detailed summary of the historical variations registered by NZD/USD:
Near a new LOW record (1 year)
Type : Bearish
Timeframe : Weekly
Near a new LOW record (1st january)
Type : Bearish
Timeframe : Weekly
Near a new HIGH record (1 month)
Type : Bullish
Timeframe : Weekly
New LOW record (1 month)
Type : Bearish
Timeframe : Weekly
Technical
A technical analysis in Daily of this NZD/USD chart shows a sharp bearish trend. 89.29% of the signals given by moving averages are bearish. This strongly bearish trend is supported by the strong bearish signals given by short-term moving averages. The Central Indicators scanner does not detect any result on moving averages that would impact this trend.
In fact, 14 technical indicators on 18 studied are currently bearish. Caution: the Central Indicators scanner currently detects an excess:
RSI indicator is oversold : under 30
Type : Neutral
Timeframe : Daily
CCI indicator is oversold : under -100
Type : Neutral
Timeframe : Daily
Williams %R indicator is oversold : under -80
Type : Neutral
Timeframe : Daily
Pivot points : price is under support 1
Type : Neutral
Timeframe : Daily
An analysis of the price chart with the Central Patterns scanner (detector of chart patterns and resistances and supports) shows a result that can have an impact on the price change:
Near support of channel
Type : Bullish
Timeframe : Daily
No result was found by the Central Candlesticks scanner on Japanese candlesticks.
| S3 | S2 | S1 | Price | R1 | R2 | R3 | |
|---|---|---|---|---|---|---|---|
| ProTrendLines | 0.5562 | 0.5792 | 0.5878 | 0.5879 | 0.5993 | 0.6064 | 0.6106 |
| Change (%) | -5.39% | -1.48% | -0.02% | - | +1.94% | +3.15% | +3.86% |
| Change | -0.0317 | -0.0087 | -0.0001 | - | +0.0114 | +0.0185 | +0.0227 |
| Level | Minor | Major | Major | - | Minor | Major | Intermediate |
Pivot points can also be used to set your price objectives. Here is the price situation in relation to pivot points:
| Pivot points | S3 | S2 | S1 | PP | R1 | R2 | R3 |
|---|---|---|---|---|---|---|---|
| Standard | 0.5854 | 0.5868 | 0.5878 | 0.5892 | 0.5902 | 0.5916 | 0.5926 |
| Camarilla | 0.5881 | 0.5884 | 0.5886 | 0.5888 | 0.5890 | 0.5892 | 0.5895 |
| Woodie | 0.5852 | 0.5867 | 0.5876 | 0.5891 | 0.5900 | 0.5915 | 0.5924 |
| Fibonacci | 0.5868 | 0.5877 | 0.5883 | 0.5892 | 0.5901 | 0.5907 | 0.5916 |
| Pivot points | S3 | S2 | S1 | PP | R1 | R2 | R3 |
|---|---|---|---|---|---|---|---|
| Standard | 0.5690 | 0.5785 | 0.5837 | 0.5932 | 0.5984 | 0.6079 | 0.6131 |
| Camarilla | 0.5848 | 0.5861 | 0.5875 | 0.5888 | 0.5902 | 0.5915 | 0.5928 |
| Woodie | 0.5668 | 0.5774 | 0.5815 | 0.5921 | 0.5962 | 0.6068 | 0.6109 |
| Fibonacci | 0.5785 | 0.5842 | 0.5876 | 0.5932 | 0.5989 | 0.6023 | 0.6079 |
| Pivot points | S3 | S2 | S1 | PP | R1 | R2 | R3 |
|---|---|---|---|---|---|---|---|
| Standard | 0.5860 | 0.5958 | 0.6025 | 0.6123 | 0.6190 | 0.6288 | 0.6355 |
| Camarilla | 0.6046 | 0.6061 | 0.6076 | 0.6091 | 0.6106 | 0.6121 | 0.6136 |
| Woodie | 0.5844 | 0.5950 | 0.6009 | 0.6115 | 0.6174 | 0.6280 | 0.6339 |
| Fibonacci | 0.5958 | 0.6021 | 0.6060 | 0.6123 | 0.6186 | 0.6225 | 0.6288 |
Numerical data
The following is the status of technical indicators and moving averages registered at the time this technical analysis was created:
| RSI (14): | 21.98 | |
| MACD (12,26,9): | -0.0056 | |
| Directional Movement: | -31.0060 | |
| AROON (14): | -85.7143 | |
| DEMA (21): | 0.5945 | |
| Parabolic SAR (0,02-0,02-0,2): | 0.6048 | |
| Elder Ray (13): | -0.0097 | |
| Super Trend (3,10): | 0.6001 | |
| Zig ZAG (10): | 0.5877 | |
| VORTEX (21): | 0.7612 | |
| Stochastique (14,3,5): | 4.29 | |
| TEMA (21): | 0.5898 | |
| Williams %R (14): | -92.81 | |
| Chande Momentum Oscillator (20): | -0.0217 | |
| Repulse (5,40,3): | -1.1600 | |
| ROCnROLL: | 2 | |
| TRIX (15,9): | -0.0812 | |
| Courbe Coppock: | 5.85 |
| MA7: | 0.5931 | |
| MA20: | 0.6039 | |
| MA50: | 0.6094 | |
| MA100: | 0.6050 | |
| MAexp7: | 0.5931 | |
| MAexp20: | 0.6009 | |
| MAexp50: | 0.6054 | |
| MAexp100: | 0.6063 | |
| Price / MA7: | -0.88% | |
| Price / MA20: | -2.65% | |
| Price / MA50: | -3.53% | |
| Price / MA100: | -2.83% | |
| Price / MAexp7: | -0.88% | |
| Price / MAexp20: | -2.16% | |
| Price / MAexp50: | -2.89% | |
| Price / MAexp100: | -3.03% |
News
Don't forget to follow the news on NZD/USD. At the time of publication of this analysis, the latest news was as follows:
-
 NZD/USD Forecast July 23, 2024
-
NZD/USD Forecast July 17, 2024
-
NZD/USD Forecast July 16, 2024
-
NZD/USD Forecast July 4, 2024
-
NZD/USD Forecast July 2, 2024
About author

Online


Add a comment
Comments
0 comments on the analysis NZD/USD - Daily