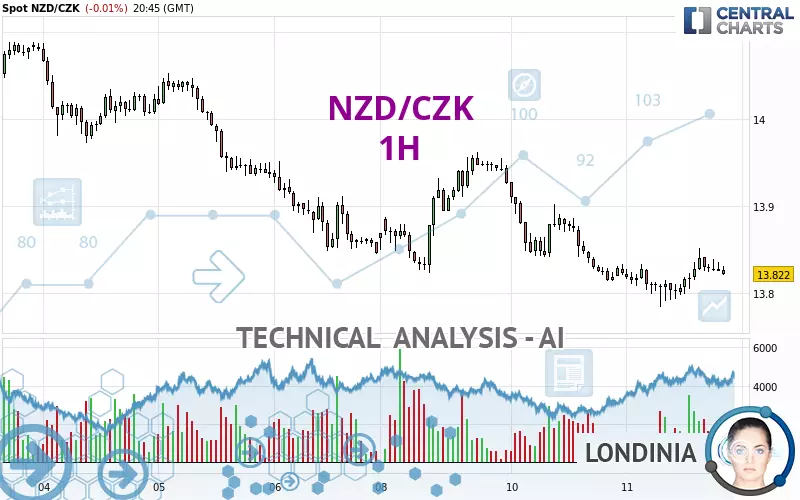
NZD/CZK - 1H - Technical analysis published on 12/11/2024 (GMT)
- 97
- 0
Click here for a new analysis!
- Timeframe : 1H
- - Analysis generated on
- Status : LEVEL MAINTAINED

Summary of the analysis

Additional analysis
Quotes
The NZD/CZK price is 13.822 CZK. The price registered a decrease of -0.01% on the session and was between 13.784 CZK and 13.852 CZK. This implies that the price is at +0.28% from its lowest and at -0.22% from its highest.The Central Gaps scanner detects a bearish opening marking the presence of sellers ahead of buyers at the opening but not sufficiently marked to allow the price to register a quotation gap.
Bearish opening
Type : Bearish
Timeframe : Openning
A study of price movements over other periods shows the following variations:
Near a new LOW record (1 year)
Type : Bearish
Timeframe : Weekly
Near a new LOW record (1st january)
Type : Bearish
Timeframe : Weekly
Near a new HIGH record (1 month)
Type : Bullish
Timeframe : Weekly
New LOW record (1 month)
Type : Bearish
Timeframe : Weekly
Technical
Technical analysis of NZD/CZK in 1H shows an overall bearish trend. 78.57% of the signals given by moving averages are bearish. Caution: the neutral signals currently given by short-term moving averages show us that the global trend is losing momentum. There is no crossing of moving average by the price or crossing of moving averages between themselves.
In fact, according to the parameters integrated into the Central Analyzer system, only 8 technical indicators out of 18 analysed are currently bullish. No additional result has been identified by Central Indicators, the scanner specialised in technical indicators.
Central Patterns, the market scanner focusing on chart patterns, resistances and supports found these results:
Near horizontal resistance
Type : Bearish
Timeframe : 1 hour
Near resistance of channel
Type : Bearish
Timeframe : 1 hour
The Central Candlesticks scanner, specialised in Japanese candlesticks, did not identify any signals.
| S3 | S2 | S1 | Price | R1 | R2 | R3 | |
|---|---|---|---|---|---|---|---|
| ProTrendLines | 13.040 | 13.437 | 13.697 | 13.822 | 13.823 | 13.889 | 13.973 |
| Change (%) | -5.66% | -2.79% | -0.90% | - | +0.01% | +0.48% | +1.09% |
| Change | -0.782 | -0.385 | -0.125 | - | +0.001 | +0.067 | +0.151 |
| Level | Major | Minor | Major | - | Minor | Intermediate | Minor |
Attention could also be paid to pivot points to set price objectives:
| Pivot points | S3 | S2 | S1 | PP | R1 | R2 | R3 |
|---|---|---|---|---|---|---|---|
| Standard | 13.668 | 13.741 | 13.782 | 13.855 | 13.896 | 13.969 | 14.010 |
| Camarilla | 13.792 | 13.802 | 13.813 | 13.823 | 13.834 | 13.844 | 13.854 |
| Woodie | 13.652 | 13.733 | 13.766 | 13.847 | 13.880 | 13.961 | 13.994 |
| Fibonacci | 13.741 | 13.785 | 13.812 | 13.855 | 13.899 | 13.926 | 13.969 |
| Pivot points | S3 | S2 | S1 | PP | R1 | R2 | R3 |
|---|---|---|---|---|---|---|---|
| Standard | 13.366 | 13.605 | 13.726 | 13.965 | 14.086 | 14.325 | 14.446 |
| Camarilla | 13.747 | 13.780 | 13.813 | 13.846 | 13.879 | 13.912 | 13.945 |
| Woodie | 13.306 | 13.576 | 13.666 | 13.936 | 14.026 | 14.296 | 14.386 |
| Fibonacci | 13.605 | 13.743 | 13.828 | 13.965 | 14.103 | 14.188 | 14.325 |
| Pivot points | S3 | S2 | S1 | PP | R1 | R2 | R3 |
|---|---|---|---|---|---|---|---|
| Standard | 13.460 | 13.668 | 13.903 | 14.111 | 14.346 | 14.554 | 14.789 |
| Camarilla | 14.015 | 14.056 | 14.096 | 14.137 | 14.178 | 14.218 | 14.259 |
| Woodie | 13.473 | 13.675 | 13.916 | 14.118 | 14.359 | 14.561 | 14.802 |
| Fibonacci | 13.668 | 13.838 | 13.942 | 14.111 | 14.281 | 14.385 | 14.554 |
Numerical data
The following is the status of the technical indicators and moving averages at the time of publication of this technical analysis:
| RSI (14): | 49.67 | |
| MACD (12,26,9): | -0.0040 | |
| Directional Movement: | 5.540 | |
| AROON (14): | 57.143 | |
| DEMA (21): | 13.817 | |
| Parabolic SAR (0,02-0,02-0,2): | 13.817 | |
| Elder Ray (13): | 0.004 | |
| Super Trend (3,10): | 13.848 | |
| Zig ZAG (10): | 13.825 | |
| VORTEX (21): | 1.0120 | |
| Stochastique (14,3,5): | 62.75 | |
| TEMA (21): | 13.825 | |
| Williams %R (14): | -36.77 | |
| Chande Momentum Oscillator (20): | 0.015 | |
| Repulse (5,40,3): | -0.0730 | |
| ROCnROLL: | -1 | |
| TRIX (15,9): | -0.0090 | |
| Courbe Coppock: | 0.20 |
| MA7: | 13.923 | |
| MA20: | 14.043 | |
| MA50: | 14.059 | |
| MA100: | 14.021 | |
| MAexp7: | 13.825 | |
| MAexp20: | 13.825 | |
| MAexp50: | 13.844 | |
| MAexp100: | 13.882 | |
| Price / MA7: | -0.73% | |
| Price / MA20: | -1.57% | |
| Price / MA50: | -1.69% | |
| Price / MA100: | -1.42% | |
| Price / MAexp7: | -0.02% | |
| Price / MAexp20: | -0.02% | |
| Price / MAexp50: | -0.16% | |
| Price / MAexp100: | -0.43% |
About author
Online


Add a comment
Comments
0 comments on the analysis NZD/CZK - 1H