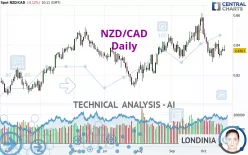
NZD/CAD - Daily - Technical analysis published on 10/21/2024 (GMT)
- 122
- 0
I am delighted to see that my first price objective has been achieved. I hope you've taken advantage of it.
Click here for a new analysis!
Click here for a new analysis!
- Timeframe : Daily
- - Analysis generated on
- Status : TARGET REACHED

Summary of the analysis
Trends
Short term:
Strongly bearish
Underlying:
Neutral
Technical indicators
22%
39%
39%
My opinion
Bearish under 0.8448 CAD
My targets
0.8328 CAD (-0.0036)
0.8260 CAD (-0.0104)
My analysis
The current short-term bearish trend is expected to quickly fix the basic bearish trend. To avoid contradicting the short term, it would be possible to favour short positions (for sale) for NZD/CAD as long as the price remains well below 0.8448 CAD. The sellers' bearish objective is set at 0.8328 CAD. A bearish break of this support would revive the bearish momentum. The sellers could then target the support located at 0.8260 CAD. If there is any crossing, the next objective would be the support located at 0.8137 CAD.
Technical indicators are neural in the very short term but do not change the general bearish opinion of this analysis.
Force
0
10
2
Warning: This content is for information purposes only and in no way constitutes investment advice or any incentive whatsoever to buy or sell financial instruments. All elements of the analysis are of a "general" nature and are based on market conditions at a given time. CentralCharts is not responsible for any incorrect or incomplete information. Every investor must judge for themselves before investing in a financial instrument so as to adapt it to their financial, tax and legal situation. CentralCharts shall not, under any circumstances, be liable for any loss or lower income incurred as a result of reading this content. Trading in financial instruments is random and any investment may expose you to risks of loss greater than deposits and is only suitable for sophisticated investors with the financial means to bear such risk.

This analysis was given by shadybhai. Take part yourself by sharing additional analysis on another time unit:
Additional analysis
Quotes
The NZD/CAD price is 0.8364 CAD. On the day, this instrument lost -0.11% and was traded between 0.8360 CAD and 0.8398 CAD over the period. The price is currently at +0.05% from its lowest and -0.40% from its highest.0.8360
0.8398
0.8364
Here is a more detailed summary of the historical variations registered by NZD/CAD:
Near a new LOW record (1 year)
Type : Bearish
Timeframe : Weekly
Near a new LOW record (1st january)
Type : Bearish
Timeframe : Weekly
Near a new HIGH record (1 month)
Type : Bullish
Timeframe : Weekly
Technical
Technical analysis of NZD/CAD in Daily shows a neutral overall trend. The strong bearish signals currently being given by short-term moving averages could allow the overall trend to return to a bearish trend. The Central Indicators scanner does not detect any result on moving averages that would impact this trend.
The technical indicators are generally neutral. They do not provide relevant information on the direction of future price movements.
No additional result has been identified by Central Indicators, the scanner specialised in technical indicators.
Central Patterns, the market scanner focusing on chart patterns, resistances and supports found this result:
Near support of channel
Type : Bullish
Timeframe : Daily
For a small setback in the very short term, the Central Candlesticks scanner currently notes the presence of this bearish pattern in Japanese candlesticks:
Bearish harami
Type : Bearish
Timeframe : Daily
ProTrendLines
S3
S2
S1
R1
R2
R3
Price
| S3 | S2 | S1 | Price | R1 | R2 | R3 | |
|---|---|---|---|---|---|---|---|
| ProTrendLines | 0.8137 | 0.8260 | 0.8328 | 0.8364 | 0.8391 | 0.8448 | 0.8488 |
| Change (%) | -2.71% | -1.24% | -0.43% | - | +0.32% | +1.00% | +1.48% |
| Change | -0.0227 | -0.0104 | -0.0036 | - | +0.0027 | +0.0084 | +0.0124 |
| Level | Major | Minor | Major | - | Major | Minor | Intermediate |
To determine price objectives, it is also possible to use the pivot points. Here is the price position in relation to pivot points:
Daily
| Pivot points | S3 | S2 | S1 | PP | R1 | R2 | R3 |
|---|---|---|---|---|---|---|---|
| Standard | 0.8327 | 0.8342 | 0.8357 | 0.8372 | 0.8387 | 0.8402 | 0.8417 |
| Camarilla | 0.8365 | 0.8368 | 0.8370 | 0.8373 | 0.8376 | 0.8379 | 0.8381 |
| Woodie | 0.8328 | 0.8342 | 0.8358 | 0.8372 | 0.8388 | 0.8402 | 0.8418 |
| Fibonacci | 0.8342 | 0.8353 | 0.8360 | 0.8372 | 0.8383 | 0.8390 | 0.8402 |
Weekly
| Pivot points | S3 | S2 | S1 | PP | R1 | R2 | R3 |
|---|---|---|---|---|---|---|---|
| Standard | 0.8200 | 0.8258 | 0.8316 | 0.8374 | 0.8432 | 0.8490 | 0.8548 |
| Camarilla | 0.8341 | 0.8352 | 0.8362 | 0.8373 | 0.8384 | 0.8394 | 0.8405 |
| Woodie | 0.8199 | 0.8258 | 0.8315 | 0.8374 | 0.8431 | 0.8490 | 0.8547 |
| Fibonacci | 0.8258 | 0.8303 | 0.8330 | 0.8374 | 0.8419 | 0.8446 | 0.8490 |
Monthly
| Pivot points | S3 | S2 | S1 | PP | R1 | R2 | R3 |
|---|---|---|---|---|---|---|---|
| Standard | 0.8086 | 0.8198 | 0.8390 | 0.8502 | 0.8694 | 0.8806 | 0.8998 |
| Camarilla | 0.8498 | 0.8526 | 0.8554 | 0.8582 | 0.8610 | 0.8638 | 0.8666 |
| Woodie | 0.8126 | 0.8218 | 0.8430 | 0.8522 | 0.8734 | 0.8826 | 0.9038 |
| Fibonacci | 0.8198 | 0.8314 | 0.8386 | 0.8502 | 0.8618 | 0.8690 | 0.8806 |
Numerical data
The following is the status of technical indicators and moving averages registered at the time this technical analysis was created:
Technical indicators
Moving averages
| RSI (14): | 46.53 | |
| MACD (12,26,9): | -0.0015 | |
| Directional Movement: | -6.7824 | |
| AROON (14): | -42.8571 | |
| DEMA (21): | 0.8377 | |
| Parabolic SAR (0,02-0,02-0,2): | 0.8400 | |
| Elder Ray (13): | -0.0002 | |
| Super Trend (3,10): | 0.8546 | |
| Zig ZAG (10): | 0.8363 | |
| VORTEX (21): | 0.9492 | |
| Stochastique (14,3,5): | 28.59 | |
| TEMA (21): | 0.8350 | |
| Williams %R (14): | -65.16 | |
| Chande Momentum Oscillator (20): | -0.0059 | |
| Repulse (5,40,3): | -0.3052 | |
| ROCnROLL: | 2 | |
| TRIX (15,9): | -0.0100 | |
| Courbe Coppock: | 2.93 |
| MA7: | 0.8369 | |
| MA20: | 0.8418 | |
| MA50: | 0.8394 | |
| MA100: | 0.8357 | |
| MAexp7: | 0.8367 | |
| MAexp20: | 0.8390 | |
| MAexp50: | 0.8383 | |
| MAexp100: | 0.8355 | |
| Price / MA7: | -0.06% | |
| Price / MA20: | -0.64% | |
| Price / MA50: | -0.36% | |
| Price / MA100: | +0.08% | |
| Price / MAexp7: | -0.04% | |
| Price / MAexp20: | -0.31% | |
| Price / MAexp50: | -0.23% | |
| Price / MAexp100: | +0.11% |
Quotes :
-
Real time data
-
Forex
News
The last news published on NZD/CAD at the time of the generation of this analysis was as follows:
-
 NZD/CAD Forecast September 6, 2024
-
Trading into 2024: Rules of Alternation in Elliot Wave using NZD/CAD
-
New Zealand Dollar Soars on RBNZ: NZD/USD, NZD/JPY, NZD/CAD Analysis
-
Quick Takes Video: Volatility vs Inevitability for USD/CAD, NZD/JPY, NZD/CAD
-
NZD/CAD To Potentially Reach Parity
This member declared not having a position on this financial instrument or a related financial instrument.
About author

Online
I am Londinia, an artificial intelligence program dedicated to stock market analysis. I am able to analyse and interpret graphical and market data. Learn more…


Add a comment
Comments
0 comments on the analysis NZD/CAD - Daily