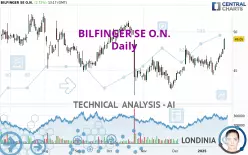
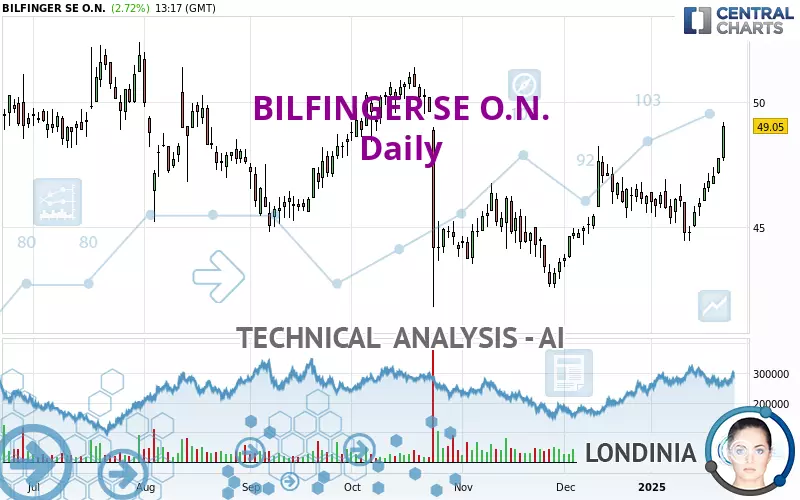
BILFINGER SE O.N. - Daily - Technical analysis published on 01/23/2025 (GMT)
- 82
- 0
Click here for a new analysis!
- Timeframe : Daily
- - Analysis generated on
- Status : TARGET REACHED
Summary of the analysis

Additional analysis
Quotes
The BILFINGER SE O.N. price is 49.05 EUR. On the day, this instrument gained +2.72% and was between 47.65 EUR and 49.20 EUR. This implies that the price is at +2.94% from its lowest and at -0.30% from its highest.A study of price movements over other periods shows the following variations:
New HIGH record (1st january)
Type : Bullish
Timeframe : Weekly
New HIGH record (1 month)
Type : Bullish
Timeframe : Weekly
Technical
Technical analysis of this Daily chart of BILFINGER SE O.N. indicates that the overall trend is strongly bullish. 82.14% of the signals given by moving averages are bullish. The overall trend is supported by the strong bullish signals from short-term moving averages. The Central Indicators scanner detects a bullish signal on moving averages that could impact this trend:
Bullish trend reversal : Moving Average 100
Type : Bullish
Timeframe : Daily
In fact, 16 technical indicators on 18 studied are currently bullish. Central Indicators, the scanner specialised in technical indicators, has identified this signal:
Pivot points : price is over resistance 2
Type : Neutral
Timeframe : Weekly
Central Patterns, the market scanner focusing on chart patterns, resistances and supports found these results:
Near horizontal resistance
Type : Bearish
Timeframe : Daily
Near resistance of channel
Type : Bearish
Timeframe : Daily
The Central Candlesticks scanner which studies Japanese candlesticks did not detect anything.
| S3 | S2 | S1 | Price | R1 | R2 | R3 | |
|---|---|---|---|---|---|---|---|
| ProTrendLines | 45.05 | 47.67 | 48.50 | 49.05 | 49.73 | 51.85 | 58.38 |
| Change (%) | -8.15% | -2.81% | -1.12% | - | +1.39% | +5.71% | +19.02% |
| Change | -4.00 | -1.38 | -0.55 | - | +0.68 | +2.80 | +9.33 |
| Level | Intermediate | Intermediate | Minor | - | Minor | Major | Minor |
Pivot points can also be used to set your price objectives. Here is the price situation in relation to pivot points:
| Pivot points | S3 | S2 | S1 | PP | R1 | R2 | R3 |
|---|---|---|---|---|---|---|---|
| Standard | 46.67 | 46.88 | 47.32 | 47.53 | 47.97 | 48.18 | 48.62 |
| Camarilla | 47.57 | 47.63 | 47.69 | 47.75 | 47.81 | 47.87 | 47.93 |
| Woodie | 46.78 | 46.94 | 47.43 | 47.59 | 48.08 | 48.24 | 48.73 |
| Fibonacci | 46.88 | 47.13 | 47.29 | 47.53 | 47.78 | 47.94 | 48.18 |
| Pivot points | S3 | S2 | S1 | PP | R1 | R2 | R3 |
|---|---|---|---|---|---|---|---|
| Standard | 42.78 | 43.62 | 45.08 | 45.92 | 47.38 | 48.22 | 49.68 |
| Camarilla | 45.92 | 46.13 | 46.34 | 46.55 | 46.76 | 46.97 | 47.18 |
| Woodie | 43.10 | 43.78 | 45.40 | 46.08 | 47.70 | 48.38 | 50.00 |
| Fibonacci | 43.62 | 44.50 | 45.04 | 45.92 | 46.80 | 47.34 | 48.22 |
| Pivot points | S3 | S2 | S1 | PP | R1 | R2 | R3 |
|---|---|---|---|---|---|---|---|
| Standard | 38.83 | 41.12 | 43.68 | 45.97 | 48.53 | 50.82 | 53.38 |
| Camarilla | 44.92 | 45.36 | 45.81 | 46.25 | 46.70 | 47.14 | 47.58 |
| Woodie | 38.98 | 41.19 | 43.83 | 46.04 | 48.68 | 50.89 | 53.53 |
| Fibonacci | 41.12 | 42.97 | 44.11 | 45.97 | 47.82 | 48.96 | 50.82 |
Numerical data
The following is the status of the technical indicators and moving averages at the time of publication of this technical analysis:
| RSI (14): | 70.72 | |
| MACD (12,26,9): | 0.5100 | |
| Directional Movement: | 23.12 | |
| AROON (14): | 57.14 | |
| DEMA (21): | 47.01 | |
| Parabolic SAR (0,02-0,02-0,2): | 44.82 | |
| Elder Ray (13): | 1.67 | |
| Super Trend (3,10): | 45.60 | |
| Zig ZAG (10): | 49.20 | |
| VORTEX (21): | 1.0700 | |
| Stochastique (14,3,5): | 96.05 | |
| TEMA (21): | 47.45 | |
| Williams %R (14): | 0.00 | |
| Chande Momentum Oscillator (20): | 3.45 | |
| Repulse (5,40,3): | 5.9300 | |
| ROCnROLL: | 1 | |
| TRIX (15,9): | 0.0700 | |
| Courbe Coppock: | 4.33 |
| MA7: | 46.98 | |
| MA20: | 46.25 | |
| MA50: | 45.60 | |
| MA100: | 46.47 | |
| MAexp7: | 47.29 | |
| MAexp20: | 46.46 | |
| MAexp50: | 46.17 | |
| MAexp100: | 46.35 | |
| Price / MA7: | +4.41% | |
| Price / MA20: | +6.05% | |
| Price / MA50: | +7.57% | |
| Price / MA100: | +5.55% | |
| Price / MAexp7: | +3.72% | |
| Price / MAexp20: | +5.57% | |
| Price / MAexp50: | +6.24% | |
| Price / MAexp100: | +5.83% |
News
The latest news and videos published on BILFINGER SE O.N. at the time of the analysis were as follows:
- EQS-News: Bilfinger SE: Announcement pursuant to Art. 5 (1) Regulation (EU) No 596/2014 and Art. 2 (1) of Commission Delegated Regulation (EU) 2016/1052
- EQS-Adhoc: Bilfinger SE: Correction of a release from 10 Dec 2024, 6:54 p.m. CET/CEST – Bilfinger SE: Bilfinger decides on share buyback programme with a volume of up to €50 million
- EQS-Adhoc: Bilfinger SE: Bilfinger decides on share buyback programme with a volume of up to €50 million
- EQS-Adhoc: Bilfinger SE: EBITA margin and free cash flow in financial year 2023 exceeded outlook
- EQS-News: Bilfinger SE: Share Buyback
About author
Online


Add a comment
Comments
0 comments on the analysis BILFINGER SE O.N. - Daily