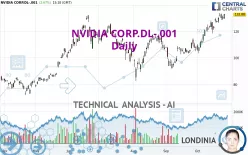
NVIDIA CORP.DL-.001 - Daily - Technical analysis published on 10/25/2024 (GMT)
- 118
- 0
Click here for a new analysis!
- Timeframe : Daily
- - Analysis generated on
- Status : INVALID

Summary of the analysis

Additional analysis
Quotes
NVIDIA CORP.DL-.001 rating 132.88 EUR. The price registered an increase of +2.67% on the session and was between 129.40 EUR and 132.88 EUR. This implies that the price is at +2.69% from its lowest and at 0% from its highest.A bearish opening was detected by the Central Gaps scanner. Sellers are trying to impose a bearish trend in the very short term.
Bearish opening
Type : Bearish
Timeframe : Openning
So that you have an overall view of the price change, here is a table showing the variations over several periods:
New HIGH record (5 years)
Type : Bullish
Timeframe : Weekly
Near a new HIGH record (1 year)
Type : Bullish
Timeframe : Weekly
Near a new HIGH record (1st january)
Type : Bullish
Timeframe : Weekly
Near a new HIGH record (1 month)
Type : Bullish
Timeframe : Weekly
Technical
Technical analysis of this Daily chart of NVIDIA CORP.DL-.001 indicates that the overall trend is strongly bullish. The signals given by the moving averages are 92.86% bullish. This strong bullish trend is confirmed by the strong signals currently being given by short-term moving averages. There is no crossing of moving average by the price or crossing of moving averages between themselves.
In fact, according to the parameters integrated into the Central Analyzer system, 13 technical indicators out of 18 analysed are currently bullish. But beware of excesses. The Central Indicators scanner currently detects this:
Williams %R indicator is overbought : over -20
Type : Neutral
Timeframe : Daily
Pivot points : price is over resistance 1
Type : Neutral
Timeframe : Weekly
Central Patterns, the market scanner focusing on chart patterns, resistances and supports found this result:
Near resistance of channel
Type : Bearish
Timeframe : Daily
For a small rebound in the very short term, the Central Candlesticks scanner currently notes the presence of this bullish pattern in Japanese candlesticks:
Bullish engulfing lines
Type : Bullish
Timeframe : Daily
| S3 | S2 | S1 | Price | |
|---|---|---|---|---|
| ProTrendLines | 91.84 | 115.22 | 129.60 | 132.88 |
| Change (%) | -30.89% | -13.29% | -2.47% | - |
| Change | -41.04 | -17.66 | -3.28 | - |
| Level | Major | Intermediate | Major | - |
Attention could also be paid to pivot points to set price objectives:
| Pivot points | S3 | S2 | S1 | PP | R1 | R2 | R3 |
|---|---|---|---|---|---|---|---|
| Standard | 124.27 | 126.27 | 127.85 | 129.85 | 131.43 | 133.43 | 135.01 |
| Camarilla | 128.44 | 128.76 | 129.09 | 129.42 | 129.75 | 130.08 | 130.41 |
| Woodie | 124.05 | 126.17 | 127.63 | 129.75 | 131.21 | 133.33 | 134.79 |
| Fibonacci | 126.27 | 127.64 | 128.49 | 129.85 | 131.22 | 132.07 | 133.43 |
| Pivot points | S3 | S2 | S1 | PP | R1 | R2 | R3 |
|---|---|---|---|---|---|---|---|
| Standard | 108.23 | 113.21 | 120.05 | 125.03 | 131.87 | 136.85 | 143.69 |
| Camarilla | 123.65 | 124.73 | 125.82 | 126.90 | 127.98 | 129.07 | 130.15 |
| Woodie | 109.17 | 113.68 | 120.99 | 125.50 | 132.81 | 137.32 | 144.63 |
| Fibonacci | 113.21 | 117.72 | 120.51 | 125.03 | 129.54 | 132.33 | 136.85 |
| Pivot points | S3 | S2 | S1 | PP | R1 | R2 | R3 |
|---|---|---|---|---|---|---|---|
| Standard | 72.66 | 82.26 | 95.30 | 104.90 | 117.94 | 127.54 | 140.58 |
| Camarilla | 102.11 | 104.19 | 106.27 | 108.34 | 110.42 | 112.49 | 114.57 |
| Woodie | 74.38 | 83.12 | 97.02 | 105.76 | 119.66 | 128.40 | 142.30 |
| Fibonacci | 82.26 | 90.91 | 96.25 | 104.90 | 113.55 | 118.89 | 127.54 |
Numerical data
The following is the status of technical indicators and moving averages registered at the time this technical analysis was created:
| RSI (14): | 68.25 | |
| MACD (12,26,9): | 6.0100 | |
| Directional Movement: | 20.72 | |
| AROON (14): | 78.57 | |
| DEMA (21): | 130.57 | |
| Parabolic SAR (0,02-0,02-0,2): | 128.28 | |
| Elder Ray (13): | 4.79 | |
| Super Trend (3,10): | 119.13 | |
| Zig ZAG (10): | 132.50 | |
| VORTEX (21): | 1.1600 | |
| Stochastique (14,3,5): | 85.51 | |
| TEMA (21): | 133.69 | |
| Williams %R (14): | -7.11 | |
| Chande Momentum Oscillator (20): | 10.62 | |
| Repulse (5,40,3): | 1.5200 | |
| ROCnROLL: | 1 | |
| TRIX (15,9): | 0.7100 | |
| Courbe Coppock: | 27.90 |
| MA7: | 129.97 | |
| MA20: | 121.68 | |
| MA50: | 112.60 | |
| MA100: | 112.23 | |
| MAexp7: | 129.36 | |
| MAexp20: | 122.96 | |
| MAexp50: | 115.50 | |
| MAexp100: | 108.66 | |
| Price / MA7: | +2.24% | |
| Price / MA20: | +9.20% | |
| Price / MA50: | +18.01% | |
| Price / MA100: | +18.40% | |
| Price / MAexp7: | +2.72% | |
| Price / MAexp20: | +8.07% | |
| Price / MAexp50: | +15.05% | |
| Price / MAexp100: | +22.29% |
About author

Online


Add a comment
Comments
0 comments on the analysis NVIDIA CORP.DL-.001 - Daily