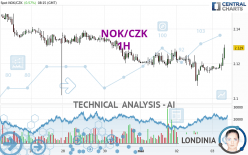
NOK/CZK - 1H - Technical analysis published on 05/03/2024 (GMT)
- 90
- 0
Click here for a new analysis!
- Timeframe : 1H
- - Analysis generated on
- Status : TARGET REACHED

Summary of the analysis

Additional analysis
Quotes
The NOK/CZK rating is 2.1290 CZK. On the day, this instrument gained +0.57% and was traded between 2.1161 CZK and 2.1308 CZK over the period. The price is currently at +0.61% from its lowest and -0.08% from its highest.A bearish opening was detected by the Central Gaps scanner. Sellers are trying to impose a bearish trend in the very short term.
Bearish opening
Type : Bearish
Timeframe : Openning
A study of price movements over other periods shows the following variations:
Near a new LOW record (1st january)
Type : Bearish
Timeframe : Weekly
Near a new HIGH record (1 month)
Type : Bullish
Timeframe : Weekly
Technical
Technical analysis of this 1H chart of NOK/CZK indicates that the overall trend is slightly bullish. 60.71% of the signals given by moving averages are bullish. This slightly bullish trend could be reinforced by the strong bullish signals given by short-term moving averages. The Central Indicators market scanner is currently detecting several bullish signals that could impact this trend:
Bullish trend reversal : Moving Average 50
Type : Bullish
Timeframe : 1 hour
Bullish trend reversal : adaptative moving average 50
Type : Bullish
Timeframe : 1 hour
Bullish price crossover with Moving Average 100
Type : Bullish
Timeframe : 1 hour
Bullish price crossover with adaptative moving average 50
Type : Bullish
Timeframe : 1 hour
Bullish price crossover with adaptative moving average 100
Type : Bullish
Timeframe : 1 hour
The probability of a further increase is high given the direction of the technical indicators.
Caution: the Central Indicators scanner currently detects an excess:
CCI indicator is overbought : over 100
Type : Neutral
Timeframe : 1 hour
Pivot points : price is over resistance 1
Type : Neutral
Timeframe : 1 hour
Ichimoku : price is over the cloud
Type : Bullish
Timeframe : 1 hour
SuperTrend indicator bullish reversal
Type : Bullish
Timeframe : 1 hour
MACD indicator is back over 0
Type : Bullish
Timeframe : 1 hour
Price is back under the pivot point
Type : Bearish
Timeframe : Weekly
An analysis of the price chart with the Central Patterns scanner (detector of chart patterns and resistances and supports) shows several results that can have an impact on the price change:
Near horizontal resistance
Type : Bearish
Timeframe : 1 hour
Resistance of channel is broken
Type : Bullish
Timeframe : 1 hour
The Central Candlesticks scanner, specialised in Japanese candlesticks, did not identify any signals.
| S3 | S2 | S1 | Price | R1 | R2 | R3 | |
|---|---|---|---|---|---|---|---|
| ProTrendLines | 2.0918 | 2.1018 | 2.1096 | 2.1290 | 2.1303 | 2.1391 | 2.1478 |
| Change (%) | -1.75% | -1.28% | -0.91% | - | +0.06% | +0.47% | +0.88% |
| Change | -0.0372 | -0.0272 | -0.0194 | - | +0.0013 | +0.0101 | +0.0188 |
| Level | Minor | Minor | Intermediate | - | Minor | Minor | Major |
Attention could also be paid to pivot points to set price objectives:
| Pivot points | S3 | S2 | S1 | PP | R1 | R2 | R3 |
|---|---|---|---|---|---|---|---|
| Standard | 2.0866 | 2.0969 | 2.1069 | 2.1172 | 2.1272 | 2.1375 | 2.1475 |
| Camarilla | 2.1114 | 2.1133 | 2.1151 | 2.1170 | 2.1189 | 2.1207 | 2.1226 |
| Woodie | 2.0866 | 2.0968 | 2.1069 | 2.1171 | 2.1272 | 2.1374 | 2.1475 |
| Fibonacci | 2.0969 | 2.1046 | 2.1094 | 2.1172 | 2.1249 | 2.1297 | 2.1375 |
| Pivot points | S3 | S2 | S1 | PP | R1 | R2 | R3 |
|---|---|---|---|---|---|---|---|
| Standard | 2.0387 | 2.0703 | 2.1009 | 2.1325 | 2.1631 | 2.1947 | 2.2253 |
| Camarilla | 2.1145 | 2.1202 | 2.1259 | 2.1316 | 2.1373 | 2.1430 | 2.1487 |
| Woodie | 2.0383 | 2.0701 | 2.1005 | 2.1323 | 2.1627 | 2.1945 | 2.2249 |
| Fibonacci | 2.0703 | 2.0940 | 2.1087 | 2.1325 | 2.1562 | 2.1709 | 2.1947 |
| Pivot points | S3 | S2 | S1 | PP | R1 | R2 | R3 |
|---|---|---|---|---|---|---|---|
| Standard | 1.9860 | 2.0439 | 2.0824 | 2.1403 | 2.1788 | 2.2367 | 2.2752 |
| Camarilla | 2.0944 | 2.1032 | 2.1121 | 2.1209 | 2.1297 | 2.1386 | 2.1474 |
| Woodie | 1.9763 | 2.0391 | 2.0727 | 2.1355 | 2.1691 | 2.2319 | 2.2655 |
| Fibonacci | 2.0439 | 2.0807 | 2.1035 | 2.1403 | 2.1771 | 2.1999 | 2.2367 |
Numerical data
The following are the details of the technical indicators and moving averages that were collected to generate this technical analysis:
| RSI (14): | 69.12 | |
| MACD (12,26,9): | 0.0006 | |
| Directional Movement: | 18.6037 | |
| AROON (14): | 71.4286 | |
| DEMA (21): | 2.1198 | |
| Parabolic SAR (0,02-0,02-0,2): | 2.1112 | |
| Elder Ray (13): | 0.0066 | |
| Super Trend (3,10): | 2.1150 | |
| Zig ZAG (10): | 2.1289 | |
| VORTEX (21): | 1.0578 | |
| Stochastique (14,3,5): | 76.80 | |
| TEMA (21): | 2.1216 | |
| Williams %R (14): | -12.20 | |
| Chande Momentum Oscillator (20): | 0.0126 | |
| Repulse (5,40,3): | 0.5360 | |
| ROCnROLL: | 1 | |
| TRIX (15,9): | -0.0043 | |
| Courbe Coppock: | 0.39 |
| MA7: | 2.1283 | |
| MA20: | 2.1542 | |
| MA50: | 2.1769 | |
| MA100: | 2.1837 | |
| MAexp7: | 2.1217 | |
| MAexp20: | 2.1195 | |
| MAexp50: | 2.1207 | |
| MAexp100: | 2.1247 | |
| Price / MA7: | +0.03% | |
| Price / MA20: | -1.17% | |
| Price / MA50: | -2.20% | |
| Price / MA100: | -2.50% | |
| Price / MAexp7: | +0.34% | |
| Price / MAexp20: | +0.45% | |
| Price / MAexp50: | +0.39% | |
| Price / MAexp100: | +0.20% |
About author
Online


Add a comment
Comments
0 comments on the analysis NOK/CZK - 1H