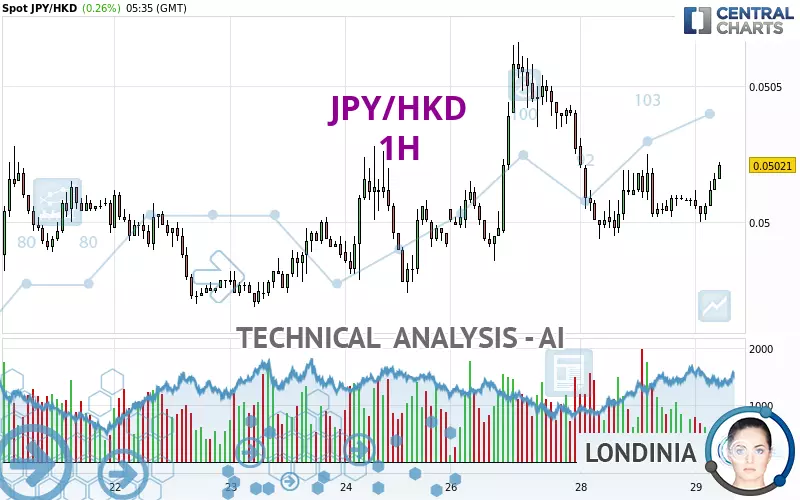
JPY/HKD - 1H - Technical analysis published on 01/29/2025 (GMT)
- 151
- 0
Click here for a new analysis!
- Timeframe : 1H
- - Analysis generated on
- Status : INVALID

Summary of the analysis

Additional analysis
Quotes
JPY/HKD rating 0.05021 HKD. On the day, this instrument gained +0.26% with the lowest point at 0.05000 HKD and the highest point at 0.05022 HKD. The deviation from the price is +0.42% for the low point and -0.02% for the high point.A study of price movements over other periods shows the following variations:
Near a new LOW record (5 years)
Type : Bearish
Timeframe : Weekly
Near a new LOW record (1 year)
Type : Bearish
Timeframe : Weekly
Near a new LOW record (1st january)
Type : Bearish
Timeframe : Weekly
Near a new LOW record (1 month)
Type : Bearish
Timeframe : Weekly
Technical
Technical analysis of this 1H chart of JPY/HKD indicates that the overall trend is strongly bullish. The signals given by the moving averages are 85.71% bullish. This strong bullish trend is confirmed by the strong signals currently being given by short-term moving averages. The Central Indicators scanner does not detect any result on moving averages that would impact this trend.
Technical indicators are strongly bullish, suggesting that the price increase should continue.
But beware of excesses. The Central Indicators scanner currently detects this:
CCI indicator is overbought : over 100
Type : Neutral
Timeframe : 1 hour
Williams %R indicator is overbought : over -20
Type : Neutral
Timeframe : 1 hour
An analysis of the price chart with the Central Patterns scanner (detector of chart patterns and resistances and supports) shows a result that can have an impact on the price change:
Near support of channel
Type : Bullish
Timeframe : 1 hour
The Central Candlesticks scanner, specialised in Japanese candlesticks, did not identify any signals.
| S3 | S2 | S1 | Price | R1 | R2 | R3 | |
|---|---|---|---|---|---|---|---|
| ProTrendLines | 0.04986 | 0.05002 | 0.05015 | 0.05021 | 0.05028 | 0.05066 | 0.05203 |
| Change (%) | -0.70% | -0.38% | -0.12% | - | +0.14% | +0.90% | +3.62% |
| Change | -0.00035 | -0.00019 | -0.00006 | - | +0.00007 | +0.00045 | +0.00182 |
| Level | Minor | Intermediate | Minor | - | Major | Minor | Major |
Attention could also be paid to pivot points to set price objectives:
| Pivot points | S3 | S2 | S1 | PP | R1 | R2 | R3 |
|---|---|---|---|---|---|---|---|
| Standard | 0.04954 | 0.04974 | 0.04991 | 0.05011 | 0.05028 | 0.05048 | 0.05065 |
| Camarilla | 0.04998 | 0.05001 | 0.05005 | 0.05008 | 0.05011 | 0.05015 | 0.05018 |
| Woodie | 0.04953 | 0.04973 | 0.04990 | 0.05010 | 0.05027 | 0.05047 | 0.05064 |
| Fibonacci | 0.04974 | 0.04988 | 0.04997 | 0.05011 | 0.05025 | 0.05034 | 0.05048 |
| Pivot points | S3 | S2 | S1 | PP | R1 | R2 | R3 |
|---|---|---|---|---|---|---|---|
| Standard | 0.04906 | 0.04937 | 0.04965 | 0.04996 | 0.05024 | 0.05055 | 0.05083 |
| Camarilla | 0.04976 | 0.04981 | 0.04987 | 0.04992 | 0.04997 | 0.05003 | 0.05008 |
| Woodie | 0.04904 | 0.04936 | 0.04963 | 0.04995 | 0.05022 | 0.05054 | 0.05081 |
| Fibonacci | 0.04937 | 0.04960 | 0.04974 | 0.04996 | 0.05019 | 0.05033 | 0.05055 |
| Pivot points | S3 | S2 | S1 | PP | R1 | R2 | R3 |
|---|---|---|---|---|---|---|---|
| Standard | 0.04498 | 0.04705 | 0.04823 | 0.05030 | 0.05148 | 0.05355 | 0.05473 |
| Camarilla | 0.04853 | 0.04882 | 0.04912 | 0.04942 | 0.04972 | 0.05002 | 0.05031 |
| Woodie | 0.04455 | 0.04683 | 0.04780 | 0.05008 | 0.05105 | 0.05333 | 0.05430 |
| Fibonacci | 0.04705 | 0.04829 | 0.04906 | 0.05030 | 0.05154 | 0.05231 | 0.05355 |
Numerical data
The following is the status of the technical indicators and moving averages at the time of publication of this technical analysis:
| RSI (14): | 57.52 | |
| MACD (12,26,9): | 0.0000 | |
| Directional Movement: | 8.65921 | |
| AROON (14): | -71.42857 | |
| DEMA (21): | 0.05009 | |
| Parabolic SAR (0,02-0,02-0,2): | 0.05023 | |
| Elder Ray (13): | 0.00008 | |
| Super Trend (3,10): | 0.05024 | |
| Zig ZAG (10): | 0.05018 | |
| VORTEX (21): | 1.1290 | |
| Stochastique (14,3,5): | 74.25 | |
| TEMA (21): | 0.05010 | |
| Williams %R (14): | -5.26 | |
| Chande Momentum Oscillator (20): | 0.00013 | |
| Repulse (5,40,3): | 0.1155 | |
| ROCnROLL: | 1 | |
| TRIX (15,9): | -0.0076 | |
| Courbe Coppock: | 0.07 |
| MA7: | 0.05002 | |
| MA20: | 0.04969 | |
| MA50: | 0.05025 | |
| MA100: | 0.05130 | |
| MAexp7: | 0.05012 | |
| MAexp20: | 0.05010 | |
| MAexp50: | 0.05011 | |
| MAexp100: | 0.05008 | |
| Price / MA7: | +0.38% | |
| Price / MA20: | +1.05% | |
| Price / MA50: | -0.08% | |
| Price / MA100: | -2.12% | |
| Price / MAexp7: | +0.18% | |
| Price / MAexp20: | +0.22% | |
| Price / MAexp50: | +0.20% | |
| Price / MAexp100: | +0.26% |
About author
Online


Add a comment
Comments
0 comments on the analysis JPY/HKD - 1H