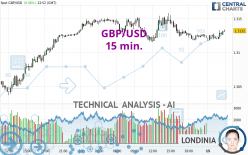
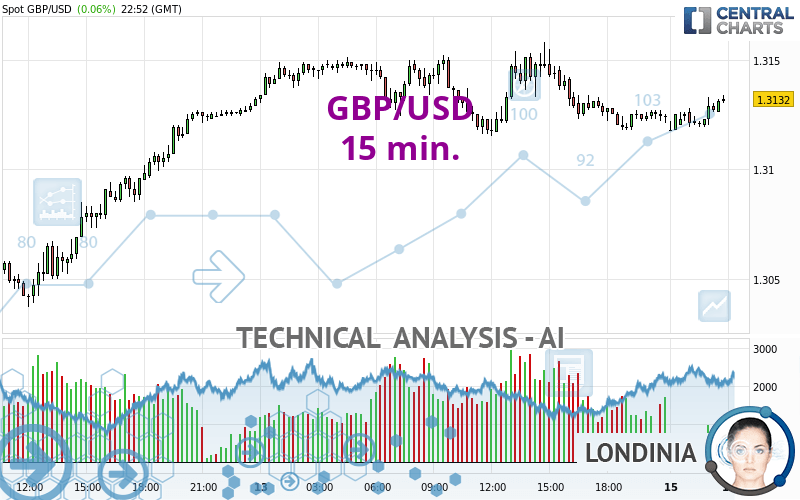
GBP/USD - 15 min. - Technical analysis published on 09/15/2024 (GMT)
- 90
- 0
Click here for a new analysis!
- Timeframe : 15 min.
- - Analysis generated on
- Status : TARGET REACHED
Summary of the analysis

Additional analysis
Quotes
GBP/USD rating 1.3132 USD. On the day, this instrument gained +0.06% and was between 1.3118 USD and 1.3134 USD. This implies that the price is at +0.11% from its lowest and at -0.02% from its highest.The Central Gaps scanner detects a bearish opening marking the presence of sellers ahead of buyers at the opening but not sufficiently marked to allow the price to register a quotation gap.
Bearish opening
Type : Bearish
Timeframe : Openning
Here is a more detailed summary of the historical variations registered by GBP/USD:
Near a new HIGH record (1 year)
Type : Bullish
Timeframe : Weekly
Near a new HIGH record (1st january)
Type : Bullish
Timeframe : Weekly
Near a new LOW record (1 month)
Type : Bearish
Timeframe : Weekly
Technical
A technical analysis in 15 min. of this GBP/USD chart shows a bullish trend. The signals returned by the moving averages are 75.00% bullish. This bullish trend is reinforced by the strong signals currently being given by short-term moving averages. The Central Indicators market scanner is currently detecting several bullish signals that could impact this trend:
Bullish trend reversal : Moving Average 50
Type : Bullish
Timeframe : 15 minutes
Bullish trend reversal : adaptative moving average 50
Type : Bullish
Timeframe : 15 minutes
Bullish price crossover with Moving Average 50
Type : Bullish
Timeframe : 15 minutes
In fact, 16 technical indicators on 18 studied are currently bullish. Caution: the Central Indicators scanner currently detects an excess:
CCI indicator is overbought : over 100
Type : Neutral
Timeframe : 15 minutes
Williams %R indicator is overbought : over -20
Type : Neutral
Timeframe : 15 minutes
Price is back over the pivot point
Type : Bullish
Timeframe : 15 minutes
No signals are given by Central Patterns, a market scanner specialised in chart patterns, resistances and supports.
No result was found by the Central Candlesticks scanner on Japanese candlesticks.
| S3 | S2 | S1 | Price | R1 | R2 | R3 | |
|---|---|---|---|---|---|---|---|
| ProTrendLines | 1.3032 | 1.3069 | 1.3128 | 1.3132 | 1.3174 | 1.3255 | 1.3705 |
| Change (%) | -0.76% | -0.48% | -0.03% | - | +0.32% | +0.94% | +4.36% |
| Change | -0.0100 | -0.0063 | -0.0004 | - | +0.0042 | +0.0123 | +0.0573 |
| Level | Minor | Minor | Major | - | Minor | Major | Minor |
To determine price objectives, it is also possible to use the pivot points. Here is the price position in relation to pivot points:
| Pivot points | S3 | S2 | S1 | PP | R1 | R2 | R3 |
|---|---|---|---|---|---|---|---|
| Standard | 1.3064 | 1.3089 | 1.3107 | 1.3132 | 1.3150 | 1.3175 | 1.3193 |
| Camarilla | 1.3112 | 1.3116 | 1.3120 | 1.3124 | 1.3128 | 1.3132 | 1.3136 |
| Woodie | 1.3060 | 1.3087 | 1.3103 | 1.3130 | 1.3146 | 1.3173 | 1.3189 |
| Fibonacci | 1.3089 | 1.3106 | 1.3116 | 1.3132 | 1.3149 | 1.3159 | 1.3175 |
| Pivot points | S3 | S2 | S1 | PP | R1 | R2 | R3 |
|---|---|---|---|---|---|---|---|
| Standard | 1.2875 | 1.2939 | 1.3031 | 1.3095 | 1.3187 | 1.3251 | 1.3343 |
| Camarilla | 1.3081 | 1.3095 | 1.3110 | 1.3124 | 1.3138 | 1.3153 | 1.3167 |
| Woodie | 1.2890 | 1.2946 | 1.3046 | 1.3102 | 1.3202 | 1.3258 | 1.3358 |
| Fibonacci | 1.2939 | 1.2998 | 1.3035 | 1.3095 | 1.3154 | 1.3191 | 1.3251 |
| Pivot points | S3 | S2 | S1 | PP | R1 | R2 | R3 |
|---|---|---|---|---|---|---|---|
| Standard | 1.2168 | 1.2416 | 1.2770 | 1.3018 | 1.3372 | 1.3620 | 1.3974 |
| Camarilla | 1.2959 | 1.3014 | 1.3069 | 1.3124 | 1.3179 | 1.3234 | 1.3290 |
| Woodie | 1.2221 | 1.2443 | 1.2823 | 1.3045 | 1.3425 | 1.3647 | 1.4027 |
| Fibonacci | 1.2416 | 1.2646 | 1.2788 | 1.3018 | 1.3248 | 1.3390 | 1.3620 |
Numerical data
The following is the status of the technical indicators and moving averages at the time of publication of this technical analysis:
| RSI (14): | 55.33 | |
| MACD (12,26,9): | -0.0001 | |
| Directional Movement: | 11.4184 | |
| AROON (14): | 57.1429 | |
| DEMA (21): | 1.3124 | |
| Parabolic SAR (0,02-0,02-0,2): | 1.3120 | |
| Elder Ray (13): | 0.0006 | |
| Super Trend (3,10): | 1.3117 | |
| Zig ZAG (10): | 1.3131 | |
| VORTEX (21): | 1.0300 | |
| Stochastique (14,3,5): | 73.33 | |
| TEMA (21): | 1.3125 | |
| Williams %R (14): | -13.33 | |
| Chande Momentum Oscillator (20): | 0.0007 | |
| Repulse (5,40,3): | 0.0310 | |
| ROCnROLL: | 1 | |
| TRIX (15,9): | -0.0026 | |
| Courbe Coppock: | 0.03 |
| MA7: | 1.3101 | |
| MA20: | 1.3132 | |
| MA50: | 1.2969 | |
| MA100: | 1.2824 | |
| MAexp7: | 1.3129 | |
| MAexp20: | 1.3126 | |
| MAexp50: | 1.3128 | |
| MAexp100: | 1.3124 | |
| Price / MA7: | +0.24% | |
| Price / MA20: | -0% | |
| Price / MA50: | +1.26% | |
| Price / MA100: | +2.40% | |
| Price / MAexp7: | +0.02% | |
| Price / MAexp20: | +0.05% | |
| Price / MAexp50: | +0.03% | |
| Price / MAexp100: | +0.06% |
News
The last news published on GBP/USD at the time of the generation of this analysis was as follows:
-
 GBP/USD Forecast September 9, 2024
-
GBP/USD Forecast August 26, 2024
-
GBP/USD Forecast August 23, 2024
-
GBP/USD Forecast August 21, 2024
-
GBP/USD Forecast August 20, 2024
About author

Online


Add a comment
Comments
0 comments on the analysis GBP/USD - 15 min.