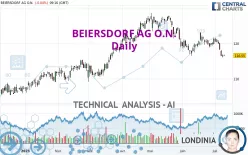
BEIERSDORF AG O.N. - Daily - Technical analysis published on 07/11/2023 (GMT)
- 157
- 0
Click here for a new analysis!
- Timeframe : Daily
- - Analysis generated on
- Status : TARGET REACHED

Summary of the analysis

Additional analysis
Quotes
BEIERSDORF AG O.N. rating 116.55 EUR. On the day, this instrument lost -0.04% and was traded between 116.50 EUR and 116.85 EUR over the period. The price is currently at +0.04% from its lowest and -0.26% from its highest.So that you have an overall view of the price change, here is a table showing the variations over several periods:
Near a new LOW record (1 month)
Type : Bearish
Timeframe : Weekly
Technical
Technical analysis of this Daily chart of BEIERSDORF AG O.N. indicates that the overall trend is bearish. The signals given by moving averages are 67.86% bearish. This bearish trend is reinforced by the strong signals currently being given by short-term moving averages. There is no crossing of moving average by the price or crossing of moving averages between themselves.
In fact, according to the parameters integrated into the Central Analyzer system, 12 technical indicators out of 18 analysed are currently bearish. Caution: the Central Indicators scanner currently detects an excess:
CCI indicator is oversold : under -100
Type : Neutral
Timeframe : Daily
Previous candle closed under Bollinger bands
Type : Neutral
Timeframe : Daily
Williams %R indicator is oversold : under -80
Type : Neutral
Timeframe : Daily
Price is back under the pivot point
Type : Bearish
Timeframe : Daily
Central Patterns, the market scanner focusing on chart patterns, resistances and supports found these results:
Near horizontal support
Type : Bullish
Timeframe : Daily
Support of channel is broken
Type : Bearish
Timeframe : Daily
Central Candlesticks, the scanner specialised in Japanese candlesticks, detects this inversion signal that could impact the current short-term trend:
Doji
Type : Neutral
Timeframe : Daily
| S3 | S2 | S1 | Price | R1 | R2 | R3 | |
|---|---|---|---|---|---|---|---|
| ProTrendLines | 105.45 | 108.98 | 114.39 | 116.55 | 117.20 | 121.86 | 124.45 |
| Change (%) | -9.52% | -6.50% | -1.85% | - | +0.56% | +4.56% | +6.78% |
| Change | -11.10 | -7.57 | -2.16 | - | +0.65 | +5.31 | +7.90 |
| Level | Major | Intermediate | Minor | - | Major | Major | Minor |
To determine price objectives, it is also possible to use the pivot points. Here is the price position in relation to pivot points:
| Pivot points | S3 | S2 | S1 | PP | R1 | R2 | R3 |
|---|---|---|---|---|---|---|---|
| Standard | 115.22 | 115.63 | 116.12 | 116.53 | 117.02 | 117.43 | 117.92 |
| Camarilla | 116.35 | 116.44 | 116.52 | 116.60 | 116.68 | 116.77 | 116.85 |
| Woodie | 115.25 | 115.65 | 116.15 | 116.55 | 117.05 | 117.45 | 117.95 |
| Fibonacci | 115.63 | 115.98 | 116.19 | 116.53 | 116.88 | 117.09 | 117.43 |
| Pivot points | S3 | S2 | S1 | PP | R1 | R2 | R3 |
|---|---|---|---|---|---|---|---|
| Standard | 109.72 | 113.03 | 114.77 | 118.08 | 119.82 | 123.13 | 124.87 |
| Camarilla | 115.11 | 115.57 | 116.04 | 116.50 | 116.96 | 117.43 | 117.89 |
| Woodie | 108.93 | 112.64 | 113.98 | 117.69 | 119.03 | 122.74 | 124.08 |
| Fibonacci | 113.03 | 114.96 | 116.15 | 118.08 | 120.01 | 121.20 | 123.13 |
| Pivot points | S3 | S2 | S1 | PP | R1 | R2 | R3 |
|---|---|---|---|---|---|---|---|
| Standard | 110.73 | 113.62 | 117.43 | 120.32 | 124.13 | 127.02 | 130.83 |
| Camarilla | 119.41 | 120.02 | 120.64 | 121.25 | 121.86 | 122.48 | 123.09 |
| Woodie | 111.20 | 113.85 | 117.90 | 120.55 | 124.60 | 127.25 | 131.30 |
| Fibonacci | 113.62 | 116.18 | 117.76 | 120.32 | 122.88 | 124.46 | 127.02 |
Numerical data
The following is the status of the technical indicators and moving averages at the time of publication of this technical analysis:
| RSI (14): | 32.94 | |
| MACD (12,26,9): | -1.0300 | |
| Directional Movement: | -18.21 | |
| AROON (14): | -92.86 | |
| DEMA (21): | 118.05 | |
| Parabolic SAR (0,02-0,02-0,2): | 122.42 | |
| Elder Ray (13): | -2.08 | |
| Super Trend (3,10): | 120.63 | |
| Zig ZAG (10): | 116.50 | |
| VORTEX (21): | 0.9300 | |
| Stochastique (14,3,5): | 6.63 | |
| TEMA (21): | 117.55 | |
| Williams %R (14): | -91.96 | |
| Chande Momentum Oscillator (20): | -4.10 | |
| Repulse (5,40,3): | -1.4400 | |
| ROCnROLL: | 2 | |
| TRIX (15,9): | -0.0900 | |
| Courbe Coppock: | 3.78 |
| MA7: | 118.44 | |
| MA20: | 119.72 | |
| MA50: | 121.85 | |
| MA100: | 119.51 | |
| MAexp7: | 117.93 | |
| MAexp20: | 119.31 | |
| MAexp50: | 120.19 | |
| MAexp100: | 118.50 | |
| Price / MA7: | -1.60% | |
| Price / MA20: | -2.65% | |
| Price / MA50: | -4.35% | |
| Price / MA100: | -2.48% | |
| Price / MAexp7: | -1.17% | |
| Price / MAexp20: | -2.31% | |
| Price / MAexp50: | -3.03% | |
| Price / MAexp100: | -1.65% |
News
Don't forget to follow the news on BEIERSDORF AG O.N.. At the time of publication of this analysis, the latest news was as follows:
- EQS-Adhoc: Beiersdorf Aktiengesellschaft: Beiersdorf achieves strong sales growth in Q1 2023 and raises sales guidance for 2023
- Beiersdorf relies on smartShift automation for their S/4HANA transformation
- DGAP-Adhoc: Beiersdorf Aktiengesellschaft: Sales growth in the first quarter of 2022 above capital markets expectations
- DGAP-Adhoc: Beiersdorf Aktiengesellschaft: Beiersdorf to acquire prestige skin care business Chantecaille
- DGAP-Adhoc: Beiersdorf Aktiengesellschaft: Change in the Chair of the Executive Board
About author
Online


Add a comment
Comments
0 comments on the analysis BEIERSDORF AG O.N. - Daily