| Open: | - |
| Change: | - |
| Volume: | - |
| Low: | - |
| High: | - |
| High / Low range: | - |
| Type: | Forex |
| Ticker: | GBPNZD |
| ISIN: |
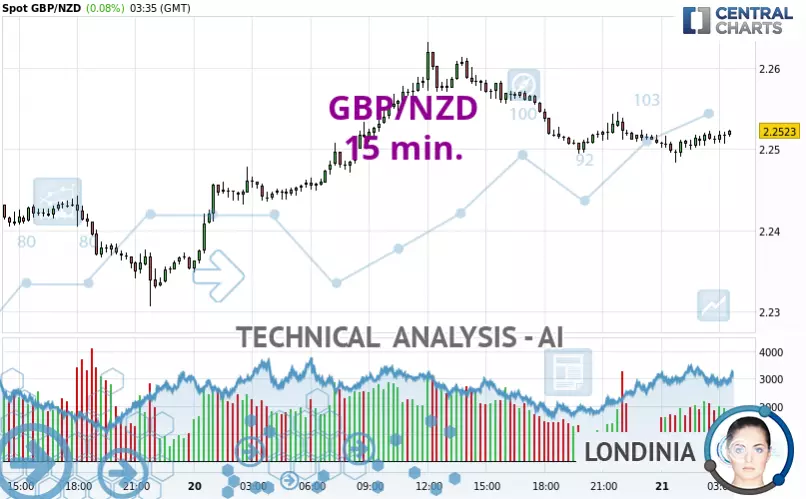
GBP/NZD - 15 min. - Technical analysis published on 03/21/2025 (GMT)
- 124
- 0
- 03/21/2025 - 03:35
Click here for a new analysis!
- Timeframe : 15 min.
- - Analysis generated on 03/21/2025 - 03:35
- Status : INVALID

Summary of the analysis

Additional analysis
Quotes
The GBP/NZD price is 2.2523 NZD. On the day, this instrument gained +0.08% and was between 2.2483 NZD and 2.2524 NZD. This implies that the price is at +0.18% from its lowest and at +0.00% from its highest.A study of price movements over other periods shows the following variations:
Near a new HIGH record (5 years)
Type : Bullish
Timeframe : Weekly
Near a new HIGH record (1 year)
Type : Bullish
Timeframe : Weekly
Near a new LOW record (1st january)
Type : Bearish
Timeframe : Weekly
Near a new LOW record (1 month)
Type : Bearish
Timeframe : Weekly
Technical
A technical analysis in 15 min. of this GBP/NZD chart shows a slightly bullish trend. Only 60.71% of the signals given by moving averages are bullish. This slightly bullish trend is not supported by the signals currently being given by short-term moving averages. The Central Indicators market scanner is currently detecting a bullish signal that could impact this trend:
Bullish price crossover with adaptative moving average 20
Type : Bullish
Timeframe : 15 minutes
In fact, 12 technical indicators on 18 studied are currently bullish. Other results related to technical indicators were also found by the Central Indicators scanner:
RSI indicator is back over 50
Type : Bullish
Timeframe : 15 minutes
Momentum indicator is back over 0
Type : Bullish
Timeframe : 15 minutes
No signals are given by Central Patterns, a market scanner specialised in chart patterns, resistances and supports.
No result was found by the Central Candlesticks scanner on Japanese candlesticks.
| S3 | S2 | S1 | Price | R1 | R2 | R3 | |
|---|---|---|---|---|---|---|---|
| ProTrendLines | 2.2359 | 2.2442 | 2.2492 | 2.2523 | 2.2578 | 2.2633 | 2.2723 |
| Change (%) | -0.73% | -0.36% | -0.14% | - | +0.24% | +0.49% | +0.89% |
| Change | -0.0164 | -0.0081 | -0.0031 | - | +0.0055 | +0.0110 | +0.0200 |
| Level | Major | Intermediate | Minor | - | Minor | Intermediate | Major |
Attention could also be paid to pivot points to set price objectives:
| Pivot points | S3 | S2 | S1 | PP | R1 | R2 | R3 |
|---|---|---|---|---|---|---|---|
| Standard | 2.2086 | 2.2221 | 2.2363 | 2.2498 | 2.2640 | 2.2775 | 2.2917 |
| Camarilla | 2.2430 | 2.2455 | 2.2481 | 2.2506 | 2.2531 | 2.2557 | 2.2582 |
| Woodie | 2.2091 | 2.2223 | 2.2368 | 2.2500 | 2.2645 | 2.2777 | 2.2922 |
| Fibonacci | 2.2221 | 2.2327 | 2.2392 | 2.2498 | 2.2604 | 2.2669 | 2.2775 |
| Pivot points | S3 | S2 | S1 | PP | R1 | R2 | R3 |
|---|---|---|---|---|---|---|---|
| Standard | 2.2114 | 2.2292 | 2.2398 | 2.2576 | 2.2682 | 2.2860 | 2.2966 |
| Camarilla | 2.2427 | 2.2453 | 2.2479 | 2.2505 | 2.2531 | 2.2557 | 2.2583 |
| Woodie | 2.2079 | 2.2274 | 2.2363 | 2.2558 | 2.2647 | 2.2842 | 2.2931 |
| Fibonacci | 2.2292 | 2.2400 | 2.2467 | 2.2576 | 2.2684 | 2.2751 | 2.2860 |
| Pivot points | S3 | S2 | S1 | PP | R1 | R2 | R3 |
|---|---|---|---|---|---|---|---|
| Standard | 2.1335 | 2.1584 | 2.2017 | 2.2266 | 2.2699 | 2.2948 | 2.3381 |
| Camarilla | 2.2263 | 2.2325 | 2.2388 | 2.2450 | 2.2513 | 2.2575 | 2.2638 |
| Woodie | 2.1427 | 2.1630 | 2.2109 | 2.2312 | 2.2791 | 2.2994 | 2.3473 |
| Fibonacci | 2.1584 | 2.1845 | 2.2006 | 2.2266 | 2.2527 | 2.2688 | 2.2948 |
Numerical data
The following is the status of technical indicators and moving averages registered at the time this technical analysis was created:
| RSI (14): | 49.60 | |
| MACD (12,26,9): | -0.0003 | |
| Directional Movement: | 0.6960 | |
| AROON (14): | 42.8572 | |
| DEMA (21): | 2.2508 | |
| Parabolic SAR (0,02-0,02-0,2): | 2.2490 | |
| Elder Ray (13): | 0.0003 | |
| Super Trend (3,10): | 2.2535 | |
| Zig ZAG (10): | 2.2517 | |
| VORTEX (21): | 0.9885 | |
| Stochastique (14,3,5): | 80.83 | |
| TEMA (21): | 2.2512 | |
| Williams %R (14): | -12.50 | |
| Chande Momentum Oscillator (20): | 0.0013 | |
| Repulse (5,40,3): | 0.0425 | |
| ROCnROLL: | -1 | |
| TRIX (15,9): | -0.0035 | |
| Courbe Coppock: | 0.02 |
| MA7: | 2.2464 | |
| MA20: | 2.2459 | |
| MA50: | 2.2146 | |
| MA100: | 2.1988 | |
| MAexp7: | 2.2514 | |
| MAexp20: | 2.2514 | |
| MAexp50: | 2.2520 | |
| MAexp100: | 2.2506 | |
| Price / MA7: | +0.26% | |
| Price / MA20: | +0.28% | |
| Price / MA50: | +1.70% | |
| Price / MA100: | +2.43% | |
| Price / MAexp7: | +0.04% | |
| Price / MAexp20: | +0.04% | |
| Price / MAexp50: | +0.01% | |
| Price / MAexp100: | +0.08% |
News
The last news published on GBP/NZD at the time of the generation of this analysis was as follows:
-
09/26/2024 - 15:23
 GBP/NZD Forecast September 27, 2024
-
01/16/2018 - 08:27
Why I'm looking to buy GBPNZD: Coleman
-
01/02/2018 - 09:40
Why I'm looking to buy GBPNZD: Coleman
-
05/12/2017 - 14:47
GBP/NZD: Pound Has Upperhand
-
05/11/2017 - 23:04
Forex Trading Video: GBP/NZD The Cross Roads of BoE and RBNZ, Dollar Faces Wave of Data
About author

Online


Add a comment
Comments
0 comments on the analysis GBP/NZD - 15 min.