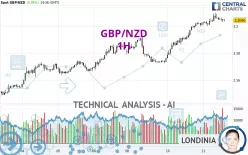
GBP/NZD - 1H - Technical analysis published on 12/11/2024 (GMT)
- 105
- 0
Click here for a new analysis!
- Timeframe : 1H
- - Analysis generated on
- Status : LEVEL MAINTAINED

Summary of the analysis

Additional analysis
Quotes
GBP/NZD rating 2.2047 NZD. On the day, this instrument gained +0.09% and was traded between 2.2001 NZD and 2.2098 NZD over the period. The price is currently at +0.21% from its lowest and -0.23% from its highest.A bullish opening was detected by the Central Gaps scanner. Buyers are trying to impose a bullish momentum in the very short term.
Bullish opening
Type : Bullish
Timeframe : Openning
So that you have an overall view of the price change, here is a table showing the variations over several periods:
New HIGH record (5 years)
Type : Bullish
Timeframe : Weekly
New HIGH record (1 year)
Type : Bullish
Timeframe : Weekly
New HIGH record (1st january)
Type : Bullish
Timeframe : Weekly
New HIGH record (1 month)
Type : Bullish
Timeframe : Weekly
Technical
Technical analysis of GBP/NZD in 1H shows a strongly overall bullish trend. 92.86% of the signals given by moving averages are bullish. The overall trend is supported by the strong bullish signals from short-term moving averages. The Central Indicators scanner detects a bullish signal on moving averages that could impact this trend:
Bullish price crossover with adaptative moving average 20
Type : Bullish
Timeframe : 1 hour
An assessment of technical indicators does not currently provide any relevant information to suggest whether the signal given by the technical indicators is more bullish or bearish.
Other results related to technical indicators were also found by the Central Indicators scanner:
Pivot points : price is over resistance 1
Type : Neutral
Timeframe : Weekly
Williams %R indicator is back over -50
Type : Bullish
Timeframe : 1 hour
The analysis of the price chart with Central Patterns scanners does not return any result.
The presence of a bullish Japanese candlestick pattern detected by Central Candlesticks that could cause a very short term rebound was also detected:
Bullish harami
Type : Bullish
Timeframe : 1 hour
| S3 | S2 | S1 | Price | R1 | R2 | |
|---|---|---|---|---|---|---|
| ProTrendLines | 2.1521 | 2.1723 | 2.1883 | 2.2047 | 2.4519 | 2.8827 |
| Change (%) | -2.39% | -1.47% | -0.74% | - | +11.21% | +30.75% |
| Change | -0.0526 | -0.0324 | -0.0164 | - | +0.2472 | +0.6780 |
| Level | Major | Intermediate | Major | - | Major | Minor |
To determine price objectives, it is also possible to use the pivot points. Here is the price position in relation to pivot points:
| Pivot points | S3 | S2 | S1 | PP | R1 | R2 | R3 |
|---|---|---|---|---|---|---|---|
| Standard | 2.1579 | 2.1670 | 2.1848 | 2.1939 | 2.2117 | 2.2208 | 2.2386 |
| Camarilla | 2.1953 | 2.1978 | 2.2002 | 2.2027 | 2.2052 | 2.2076 | 2.2101 |
| Woodie | 2.1624 | 2.1692 | 2.1893 | 2.1961 | 2.2162 | 2.2230 | 2.2431 |
| Fibonacci | 2.1670 | 2.1772 | 2.1836 | 2.1939 | 2.2041 | 2.2105 | 2.2208 |
| Pivot points | S3 | S2 | S1 | PP | R1 | R2 | R3 |
|---|---|---|---|---|---|---|---|
| Standard | 2.1215 | 2.1347 | 2.1600 | 2.1732 | 2.1985 | 2.2117 | 2.2370 |
| Camarilla | 2.1746 | 2.1781 | 2.1817 | 2.1852 | 2.1887 | 2.1923 | 2.1958 |
| Woodie | 2.1275 | 2.1377 | 2.1660 | 2.1762 | 2.2045 | 2.2147 | 2.2430 |
| Fibonacci | 2.1347 | 2.1494 | 2.1585 | 2.1732 | 2.1879 | 2.1970 | 2.2117 |
| Pivot points | S3 | S2 | S1 | PP | R1 | R2 | R3 |
|---|---|---|---|---|---|---|---|
| Standard | 2.0900 | 2.1131 | 2.1316 | 2.1547 | 2.1732 | 2.1963 | 2.2148 |
| Camarilla | 2.1387 | 2.1425 | 2.1463 | 2.1501 | 2.1539 | 2.1577 | 2.1615 |
| Woodie | 2.0877 | 2.1120 | 2.1293 | 2.1536 | 2.1709 | 2.1952 | 2.2125 |
| Fibonacci | 2.1131 | 2.1290 | 2.1388 | 2.1547 | 2.1706 | 2.1804 | 2.1963 |
Numerical data
The following is the status of technical indicators and moving averages registered at the time this technical analysis was created:
| RSI (14): | 65.93 | |
| MACD (12,26,9): | 0.0033 | |
| Directional Movement: | 11.0980 | |
| AROON (14): | 35.7143 | |
| DEMA (21): | 2.2076 | |
| Parabolic SAR (0,02-0,02-0,2): | 2.2097 | |
| Elder Ray (13): | 0.0003 | |
| Super Trend (3,10): | 2.1986 | |
| Zig ZAG (10): | 2.2050 | |
| VORTEX (21): | 1.0836 | |
| Stochastique (14,3,5): | 47.77 | |
| TEMA (21): | 2.2068 | |
| Williams %R (14): | -53.61 | |
| Chande Momentum Oscillator (20): | 0.0024 | |
| Repulse (5,40,3): | -0.0251 | |
| ROCnROLL: | 1 | |
| TRIX (15,9): | 0.0276 | |
| Courbe Coppock: | 0.29 |
| MA7: | 2.1801 | |
| MA20: | 2.1621 | |
| MA50: | 2.1571 | |
| MA100: | 2.1434 | |
| MAexp7: | 2.2049 | |
| MAexp20: | 2.2026 | |
| MAexp50: | 2.1954 | |
| MAexp100: | 2.1869 | |
| Price / MA7: | +1.13% | |
| Price / MA20: | +1.97% | |
| Price / MA50: | +2.21% | |
| Price / MA100: | +2.86% | |
| Price / MAexp7: | -0.01% | |
| Price / MAexp20: | +0.09% | |
| Price / MAexp50: | +0.42% | |
| Price / MAexp100: | +0.81% |
News
Don't forget to follow the news on GBP/NZD. At the time of publication of this analysis, the latest news was as follows:
-
 GBP/NZD Forecast September 27, 2024
-
Why I'm looking to buy GBPNZD: Coleman
-
Why I'm looking to buy GBPNZD: Coleman
-
GBP/NZD: Pound Has Upperhand
-
Forex Trading Video: GBP/NZD The Cross Roads of BoE and RBNZ, Dollar Faces Wave of Data
About author

Online


Add a comment
Comments
0 comments on the analysis GBP/NZD - 1H