| Open: | - |
| Change: | - |
| Volume: | - |
| Low: | - |
| High: | - |
| High / Low range: | - |
| Type: | Forex |
| Ticker: | GBPMXN |
| ISIN: |
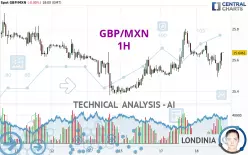
GBP/MXN - 1H - Technical analysis published on 12/18/2024 (GMT)
- 81
- 0
- 12/18/2024 - 18:00
- Timeframe : 1H
- - Analysis generated on 12/18/2024 - 18:00
- Status : NEUTRAL

Summary of the analysis

Additional analysis
Quotes
The GBP/MXN price is 25.6461 MXN. The price has increased by +0.00% since the last closing and was between 25.4913 MXN and 25.7155 MXN. This implies that the price is at +0.61% from its lowest and at -0.27% from its highest.A bullish opening was detected by the Central Gaps scanner. Buyers are trying to impose a bullish momentum in the very short term.
Bullish opening
Type : Bullish
Timeframe : Openning
So that you have an overall view of the price change, here is a table showing the variations over several periods:
Near a new HIGH record (1 year)
Type : Bullish
Timeframe : Weekly
Near a new HIGH record (1st january)
Type : Bullish
Timeframe : Weekly
Near a new HIGH record (1 month)
Type : Bullish
Timeframe : Weekly
Technical
Technical analysis of GBP/MXN in 1H shows a neutral overall trend. This indecision could turn into a bullish trend due to the bullish signals currently being given by short-term moving averages. An assessment of moving averages reveals a bullish signal that could impact this trend:
Bullish price crossover with adaptative moving average 50
Type : Bullish
Timeframe : 1 hour
In fact, Central Analyzer took into account 18 technical indicators and the result was as follows: 5 are bullish, 7 are neutral and 6 are bearish. Central Indicators, the scanner specialised in technical indicators, has identified these signals:
RSI indicator is back over 50
Type : Bullish
Timeframe : 1 hour
Price is back over the pivot point
Type : Bullish
Timeframe : Weekly
Williams %R indicator is back over -50
Type : Bullish
Timeframe : 1 hour
The Central Patterns scanner, which studies chart patterns, resistances and supports, has identified these signals:
Near horizontal support
Type : Bullish
Timeframe : 1 hour
Support of channel is broken
Type : Bearish
Timeframe : 1 hour
The Central Candlesticks scanner, specialised in Japanese candlesticks, did not identify any signals.
| S3 | S2 | S1 | Price | R1 | R2 | R3 | |
|---|---|---|---|---|---|---|---|
| ProTrendLines | 25.4359 | 25.4934 | 25.6192 | 25.6461 | 25.6666 | 25.7355 | 25.8316 |
| Change (%) | -0.82% | -0.60% | -0.10% | - | +0.08% | +0.35% | +0.72% |
| Change | -0.2102 | -0.1527 | -0.0269 | - | +0.0205 | +0.0894 | +0.1855 |
| Level | Minor | Major | Intermediate | - | Intermediate | Minor | Intermediate |
Pivot points can also be used to set your price objectives. Here is the price situation in relation to pivot points:
| Pivot points | S3 | S2 | S1 | PP | R1 | R2 | R3 |
|---|---|---|---|---|---|---|---|
| Standard | 25.1901 | 25.3427 | 25.4947 | 25.6473 | 25.7993 | 25.9519 | 26.1039 |
| Camarilla | 25.5629 | 25.5909 | 25.6188 | 25.6467 | 25.6746 | 25.7025 | 25.7305 |
| Woodie | 25.1898 | 25.3426 | 25.4944 | 25.6472 | 25.7990 | 25.9518 | 26.1036 |
| Fibonacci | 25.3427 | 25.4591 | 25.5309 | 25.6473 | 25.7637 | 25.8355 | 25.9519 |
| Pivot points | S3 | S2 | S1 | PP | R1 | R2 | R3 |
|---|---|---|---|---|---|---|---|
| Standard | 24.6865 | 25.0301 | 25.2143 | 25.5579 | 25.7421 | 26.0857 | 26.2699 |
| Camarilla | 25.2535 | 25.3018 | 25.3502 | 25.3986 | 25.4470 | 25.4954 | 25.5438 |
| Woodie | 24.6069 | 24.9903 | 25.1347 | 25.5181 | 25.6625 | 26.0459 | 26.1903 |
| Fibonacci | 25.0301 | 25.2317 | 25.3563 | 25.5579 | 25.7595 | 25.8841 | 26.0857 |
| Pivot points | S3 | S2 | S1 | PP | R1 | R2 | R3 |
|---|---|---|---|---|---|---|---|
| Standard | 23.9384 | 24.6750 | 25.3078 | 26.0444 | 26.6772 | 27.4138 | 28.0466 |
| Camarilla | 25.5641 | 25.6896 | 25.8152 | 25.9407 | 26.0662 | 26.1918 | 26.3173 |
| Woodie | 23.8866 | 24.6491 | 25.2560 | 26.0185 | 26.6254 | 27.3879 | 27.9948 |
| Fibonacci | 24.6750 | 25.1981 | 25.5213 | 26.0444 | 26.5675 | 26.8907 | 27.4138 |
Numerical data
The following are the details of the technical indicators and moving averages that were collected to generate this technical analysis:
| RSI (14): | 46.42 | |
| MACD (12,26,9): | -0.0097 | |
| Directional Movement: | -4.3517 | |
| AROON (14): | -50.0000 | |
| DEMA (21): | 25.6016 | |
| Parabolic SAR (0,02-0,02-0,2): | 25.4943 | |
| Elder Ray (13): | -0.0101 | |
| Super Trend (3,10): | 25.6818 | |
| Zig ZAG (10): | 25.5895 | |
| VORTEX (21): | 0.9365 | |
| Stochastique (14,3,5): | 43.26 | |
| TEMA (21): | 25.5786 | |
| Williams %R (14): | -52.45 | |
| Chande Momentum Oscillator (20): | -0.0663 | |
| Repulse (5,40,3): | 0.1167 | |
| ROCnROLL: | -1 | |
| TRIX (15,9): | 0.0001 | |
| Courbe Coppock: | 0.52 |
| MA7: | 25.6101 | |
| MA20: | 25.7554 | |
| MA50: | 25.8162 | |
| MA100: | 25.6008 | |
| MAexp7: | 25.5878 | |
| MAexp20: | 25.6075 | |
| MAexp50: | 25.5974 | |
| MAexp100: | 25.5971 | |
| Price / MA7: | +0.14% | |
| Price / MA20: | -0.42% | |
| Price / MA50: | -0.66% | |
| Price / MA100: | +0.18% | |
| Price / MAexp7: | +0.23% | |
| Price / MAexp20: | +0.15% | |
| Price / MAexp50: | +0.19% | |
| Price / MAexp100: | +0.19% |
About author
Online


Add a comment
Comments
0 comments on the analysis GBP/MXN - 1H