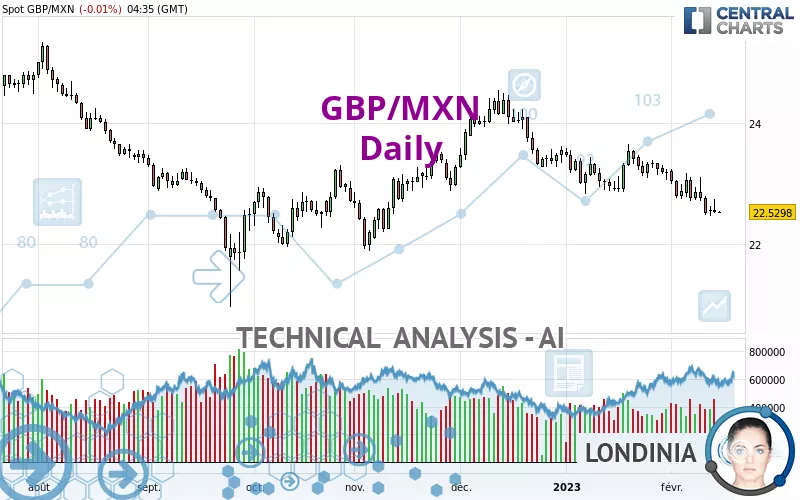
GBP/MXN - Daily - Technical analysis published on 02/15/2023 (GMT)
- 147
- 0
Click here for a new analysis!
- Timeframe : Daily
- - Analysis generated on
- Status : TARGET REACHED

Summary of the analysis

Additional analysis
Quotes
The GBP/MXN price is 22.5311 MXN. The price registered a decrease of -0.01% on the session and was between 22.5112 MXN and 22.5514 MXN. This implies that the price is at +0.09% from its lowest and at -0.09% from its highest.The Central Gaps scanner detects a bullish opening. A small advantage for buyers in the very short term.
Bullish opening
Type : Bullish
Timeframe : Openning
So that you have an overall view of the price change, here is a table showing the variations over several periods:
Near a new HIGH record (1st january)
Type : Bullish
Timeframe : Weekly
Near a new HIGH record (1 month)
Type : Bullish
Timeframe : Weekly
Technical
Technical analysis of this Daily chart of GBP/MXN indicates that the overall trend is bearish. The signals given by moving averages are 78.57% bearish. This bearish trend is reinforced by the strong signals currently being given by short-term moving averages. The Central Indicators scanner does not detect any result on moving averages that would impact this trend.
Technical indicators are bearish. There is still some doubt about the decline in the price.
Caution: the Central Indicators scanner currently detects an excess:
CCI indicator is oversold : under -100
Type : Neutral
Timeframe : Daily
Williams %R indicator is oversold : under -80
Type : Neutral
Timeframe : Daily
The Central Patterns scanner, which studies chart patterns, resistances and supports, has identified this signal:
Near horizontal support
Type : Bullish
Timeframe : Daily
No result was found by the Central Candlesticks scanner on Japanese candlesticks.
| S3 | S2 | S1 | Price | R1 | R2 | R3 | |
|---|---|---|---|---|---|---|---|
| ProTrendLines | 20.4082 | 21.8646 | 22.4889 | 22.5311 | 22.9650 | 23.5461 | 24.3734 |
| Change (%) | -9.42% | -2.96% | -0.19% | - | +1.93% | +4.50% | +8.18% |
| Change | -2.1229 | -0.6665 | -0.0422 | - | +0.4339 | +1.0150 | +1.8423 |
| Level | Minor | Major | Intermediate | - | Major | Minor | Intermediate |
Pivot points can also be used to set your price objectives. Here is the price situation in relation to pivot points:
| Pivot points | S3 | S2 | S1 | PP | R1 | R2 | R3 |
|---|---|---|---|---|---|---|---|
| Standard | 22.2180 | 22.3648 | 22.4490 | 22.5958 | 22.6800 | 22.8268 | 22.9110 |
| Camarilla | 22.4696 | 22.4908 | 22.5119 | 22.5331 | 22.5543 | 22.5755 | 22.5966 |
| Woodie | 22.1866 | 22.3492 | 22.4176 | 22.5802 | 22.6486 | 22.8112 | 22.8796 |
| Fibonacci | 22.3648 | 22.4531 | 22.5076 | 22.5958 | 22.6841 | 22.7386 | 22.8268 |
| Pivot points | S3 | S2 | S1 | PP | R1 | R2 | R3 |
|---|---|---|---|---|---|---|---|
| Standard | 21.5795 | 22.0283 | 22.2694 | 22.7182 | 22.9593 | 23.4081 | 23.6492 |
| Camarilla | 22.3208 | 22.3840 | 22.4473 | 22.5105 | 22.5737 | 22.6370 | 22.7002 |
| Woodie | 21.4757 | 21.9764 | 22.1656 | 22.6663 | 22.8555 | 23.3562 | 23.5454 |
| Fibonacci | 22.0283 | 22.2918 | 22.4547 | 22.7182 | 22.9817 | 23.1446 | 23.4081 |
| Pivot points | S3 | S2 | S1 | PP | R1 | R2 | R3 |
|---|---|---|---|---|---|---|---|
| Standard | 21.9717 | 22.3988 | 22.7979 | 23.2250 | 23.6241 | 24.0512 | 24.4503 |
| Camarilla | 22.9699 | 23.0456 | 23.1214 | 23.1971 | 23.2728 | 23.3486 | 23.4243 |
| Woodie | 21.9578 | 22.3918 | 22.7840 | 23.2180 | 23.6102 | 24.0442 | 24.4364 |
| Fibonacci | 22.3988 | 22.7144 | 22.9094 | 23.2250 | 23.5406 | 23.7356 | 24.0512 |
Numerical data
The following are the details of the technical indicators and moving averages that were collected to generate this technical analysis:
| RSI (14): | 35.62 | |
| MACD (12,26,9): | -0.2002 | |
| Directional Movement: | -3.7077 | |
| AROON (14): | -85.7143 | |
| DEMA (21): | 22.6453 | |
| Parabolic SAR (0,02-0,02-0,2): | 23.1227 | |
| Elder Ray (13): | -0.2461 | |
| Super Trend (3,10): | 23.2611 | |
| Zig ZAG (10): | 22.5142 | |
| VORTEX (21): | 0.9354 | |
| Stochastique (14,3,5): | 7.16 | |
| TEMA (21): | 22.5283 | |
| Williams %R (14): | -94.95 | |
| Chande Momentum Oscillator (20): | -0.6734 | |
| Repulse (5,40,3): | -1.2700 | |
| ROCnROLL: | 2 | |
| TRIX (15,9): | -0.0955 | |
| Courbe Coppock: | 5.38 |
| MA7: | 22.6422 | |
| MA20: | 22.9973 | |
| MA50: | 23.3215 | |
| MA100: | 23.0782 | |
| MAexp7: | 22.6447 | |
| MAexp20: | 22.8884 | |
| MAexp50: | 23.1014 | |
| MAexp100: | 23.2760 | |
| Price / MA7: | -0.49% | |
| Price / MA20: | -2.03% | |
| Price / MA50: | -3.39% | |
| Price / MA100: | -2.37% | |
| Price / MAexp7: | -0.50% | |
| Price / MAexp20: | -1.56% | |
| Price / MAexp50: | -2.47% | |
| Price / MAexp100: | -3.20% |
About author
Online


Add a comment
Comments
0 comments on the analysis GBP/MXN - Daily