| Open: | 17.05 |
| Change: | -0.15 |
| Volume: | 1,053 |
| Low: | 17.05 |
| High: | 17.05 |
| High / Low range: | 0 |
| Type: | Forex |
| Ticker: | GBPMXN |
| ISIN: |
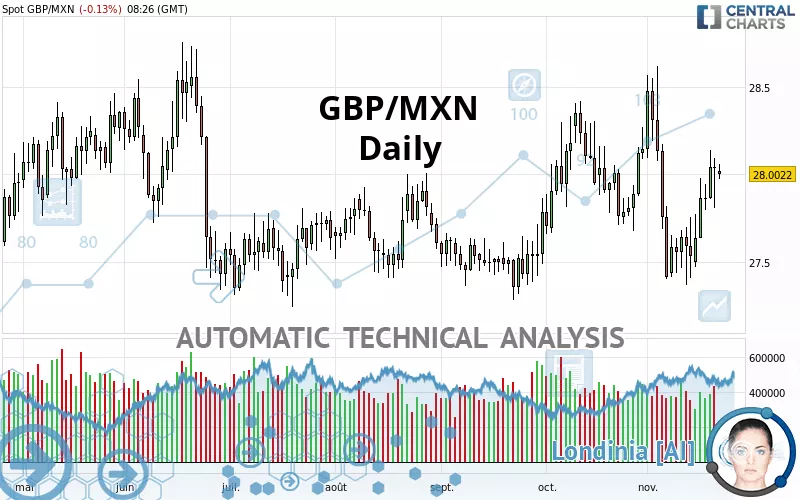
GBP/MXN - Daily - Technical analysis published on 11/22/2021 (GMT)
- 275
- 0
- 11/22/2021 - 08:28
Click here for a new analysis!
- Timeframe : Daily
- - Analysis generated on 11/22/2021 - 08:26
- Status : TARGET REACHED

Summary of the analysis

Additional analysis
Quotes
The GBP/MXN price is 28.0022 MXN. On the day, this instrument lost -0.13% and was between 27.9757 MXN and 28.0574 MXN. This implies that the price is at +0.09% from its lowest and at -0.20% from its highest.The Central Gaps scanner detects a bearish opening. A small advantage for sellers in the very short term.
Bearish opening
Type : Bearish
Timeframe : Openning
A study of price movements over other periods shows the following variations:
Near a new LOW record (1st january)
Type : Bearish
Timeframe : Weekly
Technical
Technical analysis of GBP/MXN in Daily shows a strongly overall bullish trend. The signals given by the moving averages are 92.86% bullish. This strong bullish trend is confirmed by the strong signals currently being given by short-term moving averages. The Central Indicators market scanner currently does not detect any result that concerns moving averages.
In fact, according to the parameters integrated into the Central Analyzer system, 13 technical indicators out of 18 analysed are currently bullish. Caution: the Central Indicators scanner currently detects an excess:
RSI indicator: bearish divergence
Type : Bearish
Timeframe : Daily
Price is back over the pivot point
Type : Bullish
Timeframe : Weekly
The Central Patterns scanner, which studies chart patterns, resistances and supports, has identified these signals:
Near horizontal resistance
Type : Bearish
Timeframe : Daily
Resistance of channel is broken
Type : Bullish
Timeframe : Daily
There is also a Japanese candlestick pattern detected by Central Candlesticks that could mark the end of the current short-term trend:
Doji
Type : Neutral
Timeframe : Daily
| S3 | S2 | S1 | Price | R1 | R2 | R3 | |
|---|---|---|---|---|---|---|---|
| ProTrendLines | 27.3515 | 27.7112 | 27.9054 | 28.0022 | 28.5590 | 29.3063 | 29.7163 |
| Change (%) | -2.32% | -1.04% | -0.35% | - | +1.99% | +4.66% | +6.12% |
| Change | -0.6507 | -0.2910 | -0.0968 | - | +0.5568 | +1.3041 | +1.7141 |
| Level | Intermediate | Major | Minor | - | Intermediate | Minor | Major |
Pivot points can also be used to set your price objectives. Here is the price situation in relation to pivot points:
| Pivot points | S3 | S2 | S1 | PP | R1 | R2 | R3 |
|---|---|---|---|---|---|---|---|
| Standard | 27.5845 | 27.6971 | 27.8682 | 27.9808 | 28.1519 | 28.2645 | 28.4356 |
| Camarilla | 27.9613 | 27.9873 | 28.0133 | 28.0393 | 28.0653 | 28.0913 | 28.1173 |
| Woodie | 27.6138 | 27.7117 | 27.8975 | 27.9954 | 28.1812 | 28.2791 | 28.4649 |
| Fibonacci | 27.6971 | 27.8055 | 27.8724 | 27.9808 | 28.0892 | 28.1561 | 28.2645 |
| Pivot points | S3 | S2 | S1 | PP | R1 | R2 | R3 |
|---|---|---|---|---|---|---|---|
| Standard | 26.9578 | 27.2133 | 27.6263 | 27.8818 | 28.2948 | 28.5503 | 28.9633 |
| Camarilla | 27.8555 | 27.9167 | 27.9780 | 28.0393 | 28.1006 | 28.1619 | 28.2231 |
| Woodie | 27.0366 | 27.2527 | 27.7051 | 27.9212 | 28.3736 | 28.5897 | 29.0421 |
| Fibonacci | 27.2133 | 27.4687 | 27.6264 | 27.8818 | 28.1372 | 28.2949 | 28.5503 |
| Pivot points | S3 | S2 | S1 | PP | R1 | R2 | R3 |
|---|---|---|---|---|---|---|---|
| Standard | 26.9713 | 27.3160 | 27.7296 | 28.0743 | 28.4879 | 28.8326 | 29.2462 |
| Camarilla | 27.9347 | 28.0042 | 28.0737 | 28.1432 | 28.2127 | 28.2822 | 28.3517 |
| Woodie | 27.0058 | 27.3332 | 27.7641 | 28.0915 | 28.5224 | 28.8498 | 29.2807 |
| Fibonacci | 27.3160 | 27.6057 | 27.7846 | 28.0743 | 28.3640 | 28.5429 | 28.8326 |
Numerical data
The following is the status of technical indicators and moving averages registered at the time this technical analysis was created:
| RSI (14): | 55.64 | |
| MACD (12,26,9): | 0.0109 | |
| Directional Movement: | 2.8896 | |
| AROON (14): | -42.8571 | |
| DEMA (21): | 27.8666 | |
| Parabolic SAR (0,02-0,02-0,2): | 28.1373 | |
| Elder Ray (13): | 0.1503 | |
| Super Trend (3,10): | 28.4266 | |
| Zig ZAG (10): | 28.0188 | |
| VORTEX (21): | 1.0435 | |
| Stochastique (14,3,5): | 53.12 | |
| TEMA (21): | 27.8568 | |
| Williams %R (14): | -47.76 | |
| Chande Momentum Oscillator (20): | 0.2617 | |
| Repulse (5,40,3): | 0.7391 | |
| ROCnROLL: | 1 | |
| TRIX (15,9): | -0.0131 | |
| Courbe Coppock: | 1.18 |
| MA7: | 27.8554 | |
| MA20: | 27.8727 | |
| MA50: | 27.8257 | |
| MA100: | 27.7289 | |
| MAexp7: | 27.9056 | |
| MAexp20: | 27.8626 | |
| MAexp50: | 27.8350 | |
| MAexp100: | 27.8108 | |
| Price / MA7: | +0.53% | |
| Price / MA20: | +0.46% | |
| Price / MA50: | +0.63% | |
| Price / MA100: | +0.99% | |
| Price / MAexp7: | +0.35% | |
| Price / MAexp20: | +0.50% | |
| Price / MAexp50: | +0.60% | |
| Price / MAexp100: | +0.69% |
About author

Online


Add a comment
Comments
0 comments on the analysis GBP/MXN - Daily