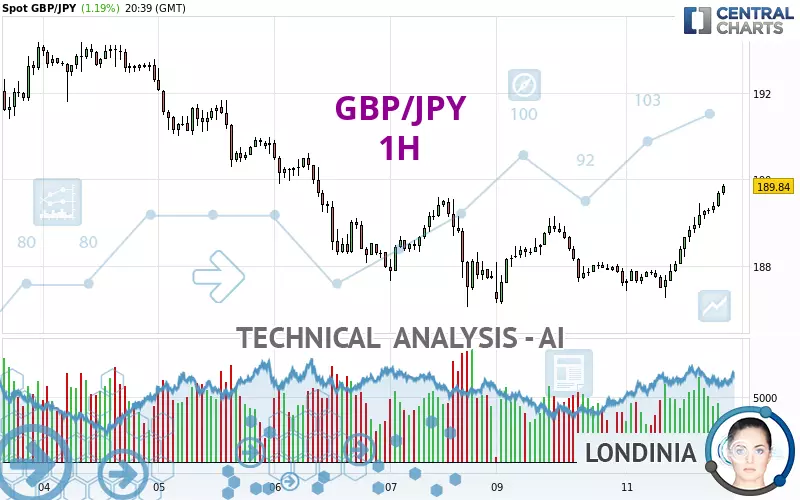
GBP/JPY - 1H - Technical analysis published on 02/11/2025 (GMT)
- 159
- 0
Click here for a new analysis!
- Timeframe : 1H
- - Analysis generated on
- Status : TARGET REACHED

Summary of the analysis

Additional analysis
Quotes
The GBP/JPY rating is 189.84 JPY. The price registered an increase of +1.19% on the session and was between 187.25 JPY and 189.90 JPY. This implies that the price is at +1.38% from its lowest and at -0.03% from its highest.Here is a more detailed summary of the historical variations registered by GBP/JPY:
Near a new LOW record (1 year)
Type : Bearish
Timeframe : Weekly
Near a new HIGH record (1st january)
Type : Bullish
Timeframe : Weekly
Near a new HIGH record (1 month)
Type : Bullish
Timeframe : Weekly
Technical
A technical analysis in 1H of this GBP/JPY chart shows a bullish trend. 67.86% of the signals given by moving averages are bullish. The overall trend is reinforced by the strong bullish signals from short-term moving averages. The Central Indicators scanner does not detect any result on moving averages that would impact this trend.
Technical indicators are strongly bullish, suggesting that the price increase should continue.
But beware of excesses. The Central Indicators scanner currently detects this:
CCI indicator: bearish divergence
Type : Bearish
Timeframe : 1 hour
Pivot points : price is over resistance 1
Type : Neutral
Timeframe : 1 hour
Price is back over the pivot point
Type : Bullish
Timeframe : Weekly
Central Patterns, the market scanner focusing on chart patterns, resistances and supports found these results:
Near horizontal resistance
Type : Bearish
Timeframe : 1 hour
Resistance of channel is broken
Type : Bullish
Timeframe : 1 hour
Central Candlesticks, the scanner specialised in Japanese candlesticks, detects this inversion signal that could impact the current short-term trend:
Doji
Type : Neutral
Timeframe : 1 hour
| S3 | S2 | S1 | Price | R1 | R2 | R3 | |
|---|---|---|---|---|---|---|---|
| ProTrendLines | 187.07 | 187.63 | 188.33 | 189.84 | 189.89 | 190.99 | 191.81 |
| Change (%) | -1.46% | -1.16% | -0.80% | - | +0.03% | +0.61% | +1.04% |
| Change | -2.77 | -2.21 | -1.51 | - | +0.05 | +1.15 | +1.97 |
| Level | Intermediate | Minor | Intermediate | - | Intermediate | Minor | Minor |
Attention could also be paid to pivot points to set price objectives:
| Pivot points | S3 | S2 | S1 | PP | R1 | R2 | R3 |
|---|---|---|---|---|---|---|---|
| Standard | 184.76 | 185.94 | 186.78 | 187.96 | 188.80 | 189.98 | 190.82 |
| Camarilla | 187.06 | 187.24 | 187.43 | 187.61 | 187.80 | 187.98 | 188.17 |
| Woodie | 184.58 | 185.86 | 186.60 | 187.88 | 188.62 | 189.90 | 190.64 |
| Fibonacci | 185.94 | 186.72 | 187.19 | 187.96 | 188.74 | 189.21 | 189.98 |
| Pivot points | S3 | S2 | S1 | PP | R1 | R2 | R3 |
|---|---|---|---|---|---|---|---|
| Standard | 179.36 | 183.21 | 185.48 | 189.33 | 191.60 | 195.45 | 197.72 |
| Camarilla | 186.08 | 186.64 | 187.20 | 187.76 | 188.32 | 188.88 | 189.44 |
| Woodie | 178.58 | 182.82 | 184.70 | 188.94 | 190.82 | 195.06 | 196.94 |
| Fibonacci | 183.21 | 185.55 | 186.99 | 189.33 | 191.67 | 193.11 | 195.45 |
| Pivot points | S3 | S2 | S1 | PP | R1 | R2 | R3 |
|---|---|---|---|---|---|---|---|
| Standard | 179.42 | 184.38 | 188.35 | 193.31 | 197.28 | 202.24 | 206.21 |
| Camarilla | 189.87 | 190.69 | 191.51 | 192.33 | 193.15 | 193.97 | 194.79 |
| Woodie | 178.94 | 184.13 | 187.87 | 193.06 | 196.80 | 201.99 | 205.73 |
| Fibonacci | 184.38 | 187.79 | 189.90 | 193.31 | 196.72 | 198.83 | 202.24 |
Numerical data
The following are the details of the technical indicators and moving averages that were collected to generate this technical analysis:
| RSI (14): | 76.94 | |
| MACD (12,26,9): | 0.4100 | |
| Directional Movement: | 24.42 | |
| AROON (14): | 78.57 | |
| DEMA (21): | 189.18 | |
| Parabolic SAR (0,02-0,02-0,2): | 188.45 | |
| Elder Ray (13): | 0.69 | |
| Super Trend (3,10): | 188.80 | |
| Zig ZAG (10): | 189.68 | |
| VORTEX (21): | 1.3400 | |
| Stochastique (14,3,5): | 97.58 | |
| TEMA (21): | 189.58 | |
| Williams %R (14): | -0.81 | |
| Chande Momentum Oscillator (20): | 2.02 | |
| Repulse (5,40,3): | 0.2500 | |
| ROCnROLL: | 1 | |
| TRIX (15,9): | 0.0200 | |
| Courbe Coppock: | 1.68 |
| MA7: | 189.89 | |
| MA20: | 191.40 | |
| MA50: | 193.29 | |
| MA100: | 194.24 | |
| MAexp7: | 189.33 | |
| MAexp20: | 188.74 | |
| MAexp50: | 188.53 | |
| MAexp100: | 188.99 | |
| Price / MA7: | -0.03% | |
| Price / MA20: | -0.82% | |
| Price / MA50: | -1.78% | |
| Price / MA100: | -2.27% | |
| Price / MAexp7: | +0.27% | |
| Price / MAexp20: | +0.58% | |
| Price / MAexp50: | +0.69% | |
| Price / MAexp100: | +0.45% |
News
The last news published on GBP/JPY at the time of the generation of this analysis was as follows:
-
 GBP/JPY Analysis: Can Sterling Break Free?
-
GBP/JPY Analysis: Can the GBP JPY Reach Higher
-
GBP/JPY Pirce Forecast - Dragon Continues to Consolidate
-
GBP/JPY Price Forecast - Sterling Races Higher After BoJ and PMI
-
GBP/JPY Price Forecast Can GBP Break 200 JPY? (January 8, 2025 Forecast)
About author

Online


Add a comment
Comments
0 comments on the analysis GBP/JPY - 1H