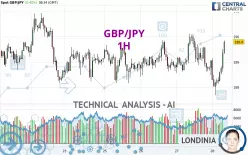
GBP/JPY - 1H - Technical analysis published on 02/28/2025 (GMT)
- 189
- 0
Click here for a new analysis!
- Timeframe : 1H
- - Analysis generated on
- Status : INVALID

Summary of the analysis

Additional analysis
Quotes
GBP/JPY rating 189.81 JPY. The price registered an increase of +0.40% on the session and was between 187.68 JPY and 189.86 JPY. This implies that the price is at +1.13% from its lowest and at -0.03% from its highest.A bullish opening was detected by the Central Gaps scanner. Buyers are trying to impose a bullish momentum in the very short term.
Bullish opening
Type : Bullish
Timeframe : Openning
Here is a more detailed summary of the historical variations registered by GBP/JPY:
Near a new LOW record (1 year)
Type : Bearish
Timeframe : Weekly
Near a new HIGH record (1st january)
Type : Bullish
Timeframe : Weekly
Near a new HIGH record (1 month)
Type : Bullish
Timeframe : Weekly
Technical
A technical analysis in 1H of this GBP/JPY chart shows a bullish trend. 71.43% of the signals given by moving averages are bullish. The overall trend seems to be showing some signs of weakness, as do the tentative bullish signals given by short-term moving averages. The Central Indicators scanner detects bullish signals on moving averages that could impact this trend:
Bullish trend reversal : Moving Average 50
Type : Bullish
Timeframe : 1 hour
Bullish trend reversal : Moving Average 100
Type : Bullish
Timeframe : 1 hour
Bullish trend reversal : adaptative moving average 50
Type : Bullish
Timeframe : 1 hour
Bullish trend reversal : adaptative moving average 100
Type : Bullish
Timeframe : 1 hour
The probability of a further increase are moderate given the direction of the technical indicators.
But beware of excesses. The Central Indicators scanner currently detects this:
CCI indicator is overbought : over 100
Type : Neutral
Timeframe : 1 hour
Williams %R indicator is overbought : over -20
Type : Neutral
Timeframe : 1 hour
SuperTrend indicator bullish reversal
Type : Bullish
Timeframe : 1 hour
An analysis of the price chart with the Central Patterns scanner (detector of chart patterns and resistances and supports) shows a result that can have an impact on the price change:
Near support of channel
Type : Bullish
Timeframe : 1 hour
No result was found by the Central Candlesticks scanner on Japanese candlesticks.
| S3 | S2 | S1 | Price | R1 | R2 | R3 | |
|---|---|---|---|---|---|---|---|
| ProTrendLines | 188.70 | 189.27 | 189.75 | 189.81 | 190.94 | 192.11 | 195.83 |
| Change (%) | -0.58% | -0.28% | -0.03% | - | +0.60% | +1.21% | +3.17% |
| Change | -1.11 | -0.54 | -0.06 | - | +1.13 | +2.30 | +6.02 |
| Level | Minor | Intermediate | Minor | - | Intermediate | Major | Intermediate |
To determine price objectives, it is also possible to use the pivot points. Here is the price position in relation to pivot points:
| Pivot points | S3 | S2 | S1 | PP | R1 | R2 | R3 |
|---|---|---|---|---|---|---|---|
| Standard | 186.69 | 187.58 | 188.32 | 189.21 | 189.95 | 190.84 | 191.58 |
| Camarilla | 188.60 | 188.75 | 188.90 | 189.05 | 189.20 | 189.35 | 189.50 |
| Woodie | 186.61 | 187.54 | 188.24 | 189.17 | 189.87 | 190.80 | 191.50 |
| Fibonacci | 187.58 | 188.21 | 188.59 | 189.21 | 189.84 | 190.22 | 190.84 |
| Pivot points | S3 | S2 | S1 | PP | R1 | R2 | R3 |
|---|---|---|---|---|---|---|---|
| Standard | 183.13 | 185.64 | 187.15 | 189.66 | 191.17 | 193.68 | 195.19 |
| Camarilla | 187.56 | 187.92 | 188.29 | 188.66 | 189.03 | 189.40 | 189.77 |
| Woodie | 182.63 | 185.39 | 186.65 | 189.41 | 190.67 | 193.43 | 194.69 |
| Fibonacci | 185.64 | 187.18 | 188.12 | 189.66 | 191.20 | 192.14 | 193.68 |
| Pivot points | S3 | S2 | S1 | PP | R1 | R2 | R3 |
|---|---|---|---|---|---|---|---|
| Standard | 179.42 | 184.38 | 188.35 | 193.31 | 197.28 | 202.24 | 206.21 |
| Camarilla | 189.87 | 190.69 | 191.51 | 192.33 | 193.15 | 193.97 | 194.79 |
| Woodie | 178.94 | 184.13 | 187.87 | 193.06 | 196.80 | 201.99 | 205.73 |
| Fibonacci | 184.38 | 187.79 | 189.90 | 193.31 | 196.72 | 198.83 | 202.24 |
Numerical data
The following is the status of technical indicators and moving averages registered at the time this technical analysis was created:
| RSI (14): | 58.38 | |
| MACD (12,26,9): | -0.0700 | |
| Directional Movement: | 9.81 | |
| AROON (14): | -57.14 | |
| DEMA (21): | 188.75 | |
| Parabolic SAR (0,02-0,02-0,2): | 187.78 | |
| Elder Ray (13): | 0.56 | |
| Super Trend (3,10): | 189.40 | |
| Zig ZAG (10): | 189.36 | |
| VORTEX (21): | 0.9600 | |
| Stochastique (14,3,5): | 76.79 | |
| TEMA (21): | 188.74 | |
| Williams %R (14): | -9.47 | |
| Chande Momentum Oscillator (20): | 0.62 | |
| Repulse (5,40,3): | 0.4200 | |
| ROCnROLL: | 1 | |
| TRIX (15,9): | -0.0100 | |
| Courbe Coppock: | 0.45 |
| MA7: | 189.08 | |
| MA20: | 190.11 | |
| MA50: | 192.62 | |
| MA100: | 193.88 | |
| MAexp7: | 188.96 | |
| MAexp20: | 188.86 | |
| MAexp50: | 188.98 | |
| MAexp100: | 189.15 | |
| Price / MA7: | +0.39% | |
| Price / MA20: | -0.16% | |
| Price / MA50: | -1.46% | |
| Price / MA100: | -2.10% | |
| Price / MAexp7: | +0.45% | |
| Price / MAexp20: | +0.50% | |
| Price / MAexp50: | +0.44% | |
| Price / MAexp100: | +0.35% |
News
The latest news and videos published on GBP/JPY at the time of the analysis were as follows:
-
 GBP/JPY Analysis: Can the Pound Find Traction Against the Yen?
-
GBP/JPY Analysis: The British Pound Looks for a Bottom Against the Yen
-
GBP/JPY Analysis: Pound Continues to Stabilize Against Yen
-
GBP/JPY Analysis: Can Sterling Break Free?
-
GBP/JPY Analysis: Can the GBP JPY Reach Higher
About author

Online


Add a comment
Comments
0 comments on the analysis GBP/JPY - 1H