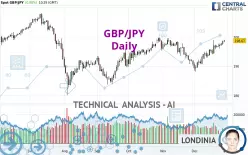
GBP/JPY - Daily - Technical analysis published on 12/30/2024 (GMT)
- 130
- 0
- Who voted?
Click here for a new analysis!
- Timeframe : Daily
- - Analysis generated on
- Status : INVALID

Summary of the analysis

Additional analysis
Quotes
The GBP/JPY price is 198.67 JPY. The price registered an increase of +0.08% on the session and was between 198.20 JPY and 198.96 JPY. This implies that the price is at +0.24% from its lowest and at -0.15% from its highest.The Central Gaps scanner detects a bearish opening marking the presence of sellers ahead of buyers at the opening but not sufficiently marked to allow the price to register a quotation gap.
Bearish opening
Type : Bearish
Timeframe : Openning
Here is a more detailed summary of the historical variations registered by GBP/JPY:
Near a new HIGH record (5 years)
Type : Bullish
Timeframe : Weekly
Near a new HIGH record (1 year)
Type : Bullish
Timeframe : Weekly
New HIGH record (1st january)
Type : Bullish
Timeframe : Weekly
New HIGH record (1 month)
Type : Bullish
Timeframe : Weekly
Technical
Technical analysis of GBP/JPY in Daily shows a strongly overall bullish trend. 89.29% of the signals given by moving averages are bullish. The overall trend is supported by the strong bullish signals from short-term moving averages. The Central Indicators scanner does not detect any result on moving averages that would impact this trend.
An assessment of technical indicators shows a strong bullish signal.
Caution: the Central Indicators scanner currently detects an excess:
CCI indicator is overbought : over 100
Type : Neutral
Timeframe : Daily
CCI indicator: bearish divergence
Type : Bearish
Timeframe : Daily
Williams %R indicator is overbought : over -20
Type : Neutral
Timeframe : Daily
Central Patterns, the market scanner focusing on chart patterns, resistances and supports found this result:
Near resistance of channel
Type : Bearish
Timeframe : Daily
No result was found by the Central Candlesticks scanner on Japanese candlesticks.
| S3 | S2 | S1 | Price | R1 | R2 | R3 | |
|---|---|---|---|---|---|---|---|
| ProTrendLines | 184.84 | 189.29 | 195.83 | 198.67 | 199.44 | 202.50 | 205.52 |
| Change (%) | -6.96% | -4.72% | -1.43% | - | +0.39% | +1.93% | +3.45% |
| Change | -13.83 | -9.38 | -2.84 | - | +0.77 | +3.83 | +6.85 |
| Level | Intermediate | Intermediate | Major | - | Major | Minor | Minor |
Attention could also be paid to pivot points to set price objectives:
| Pivot points | S3 | S2 | S1 | PP | R1 | R2 | R3 |
|---|---|---|---|---|---|---|---|
| Standard | 196.06 | 196.64 | 197.57 | 198.15 | 199.08 | 199.66 | 200.59 |
| Camarilla | 198.10 | 198.23 | 198.37 | 198.51 | 198.65 | 198.79 | 198.93 |
| Woodie | 196.25 | 196.73 | 197.76 | 198.24 | 199.27 | 199.75 | 200.78 |
| Fibonacci | 196.64 | 197.21 | 197.57 | 198.15 | 198.72 | 199.08 | 199.66 |
| Pivot points | S3 | S2 | S1 | PP | R1 | R2 | R3 |
|---|---|---|---|---|---|---|---|
| Standard | 194.06 | 195.04 | 196.77 | 197.75 | 199.48 | 200.46 | 202.19 |
| Camarilla | 197.77 | 198.01 | 198.26 | 198.51 | 198.76 | 199.01 | 199.26 |
| Woodie | 194.45 | 195.23 | 197.16 | 197.94 | 199.87 | 200.65 | 202.58 |
| Fibonacci | 195.04 | 196.07 | 196.71 | 197.75 | 198.78 | 199.42 | 200.46 |
| Pivot points | S3 | S2 | S1 | PP | R1 | R2 | R3 |
|---|---|---|---|---|---|---|---|
| Standard | 177.94 | 184.05 | 187.35 | 193.46 | 196.76 | 202.87 | 206.17 |
| Camarilla | 188.07 | 188.94 | 189.80 | 190.66 | 191.52 | 192.39 | 193.25 |
| Woodie | 176.55 | 183.35 | 185.96 | 192.76 | 195.37 | 202.17 | 204.78 |
| Fibonacci | 184.05 | 187.64 | 189.86 | 193.46 | 197.05 | 199.27 | 202.87 |
Numerical data
The following are the details of the technical indicators and moving averages that were collected to generate this technical analysis:
| RSI (14): | 64.95 | |
| MACD (12,26,9): | 1.0700 | |
| Directional Movement: | 11.33 | |
| AROON (14): | 57.14 | |
| DEMA (21): | 196.75 | |
| Parabolic SAR (0,02-0,02-0,2): | 196.01 | |
| Elder Ray (13): | 2.27 | |
| Super Trend (3,10): | 193.35 | |
| Zig ZAG (10): | 198.59 | |
| VORTEX (21): | 1.1600 | |
| Stochastique (14,3,5): | 91.10 | |
| TEMA (21): | 197.84 | |
| Williams %R (14): | -5.38 | |
| Chande Momentum Oscillator (20): | 4.13 | |
| Repulse (5,40,3): | 0.9100 | |
| ROCnROLL: | 1 | |
| TRIX (15,9): | 0.0300 | |
| Courbe Coppock: | 5.60 |
| MA7: | 197.42 | |
| MA20: | 194.44 | |
| MA50: | 195.49 | |
| MA100: | 193.24 | |
| MAexp7: | 197.31 | |
| MAexp20: | 195.66 | |
| MAexp50: | 194.89 | |
| MAexp100: | 194.53 | |
| Price / MA7: | +0.63% | |
| Price / MA20: | +2.18% | |
| Price / MA50: | +1.63% | |
| Price / MA100: | +2.81% | |
| Price / MAexp7: | +0.69% | |
| Price / MAexp20: | +1.54% | |
| Price / MAexp50: | +1.94% | |
| Price / MAexp100: | +2.13% |
News
The last news published on GBP/JPY at the time of the generation of this analysis was as follows:
-
 GBP/JPY Forecast - Will "The Dragon Roar?" (December 26, 2024)
-
GBP/JPY Forecast November 26, 2024
-
GBP/JPY Forecast October 14, 2024
-
GBP/JPY Forecast September 26, 2024
-
GBP/JPY Forecast September 11, 2024
About author

Online


Add a comment
Comments
0 comments on the analysis GBP/JPY - Daily