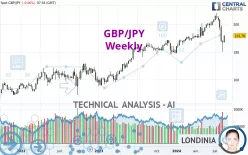
GBP/JPY - Weekly - Technical analysis published on 08/16/2024 (GMT)
- 254
- 0
Click here for a new analysis!
- Timeframe : Weekly
- - Analysis generated on
- Status : INVALID

Summary of the analysis

Additional analysis
Quotes
The GBP/JPY rating is 191.78 JPY. The price registered an increase of +2.49% over 5 days with the lowest point at 186.95 JPY and the highest point at 192.03 JPY. The deviation from the price is +2.58% for the low point and -0.13% for the high point.The Central Gaps scanner detects a bullish opening. A small advantage for buyers in the very short term.
Bullish opening
Type : Bullish
Timeframe : Openning
Here is a more detailed summary of the historical variations registered by GBP/JPY:
Technical
Technical analysis of this Weekly chart of GBP/JPY indicates that the overall trend is bullish. 75.00% of the signals given by moving averages are bullish. Caution: the neutral signals currently given by the short-term moving averages indicate that this bullish trend is showing signs of running out of steam. The Central Indicators market scanner is currently detecting several bullish signals that could impact this trend:
Bullish price crossover with Moving Average 50
Type : Bullish
Timeframe : Weekly
Bullish price crossover with adaptative moving average 100
Type : Bullish
Timeframe : Weekly
In fact, of the 18 technical indicators analysed by Central Analyzer, 3 are bullish, 9 are neutral and 6 are bearish. The Central Indicators scanner found this result concerning these indicators:
Pivot points : price is over resistance 1
Type : Neutral
Timeframe : Weekly
An analysis of the price chart with the Central Patterns scanner (detector of chart patterns and resistances and supports) shows a result that can have an impact on the price change:
Near support of channel
Type : Bullish
Timeframe : Weekly
The presence of a bullish Japanese candlestick pattern detected by Central Candlesticks that could cause a very short term rebound was also detected:
Bullish engulfing lines
Type : Bullish
Timeframe : Weekly
| S3 | S2 | S1 | Price | R1 | R2 | R3 | |
|---|---|---|---|---|---|---|---|
| ProTrendLines | 171.39 | 179.70 | 188.33 | 191.78 | 195.83 | 207.71 | 215.53 |
| Change (%) | -10.63% | -6.30% | -1.80% | - | +2.11% | +8.31% | +12.38% |
| Change | -20.39 | -12.08 | -3.45 | - | +4.05 | +15.93 | +23.75 |
| Level | Intermediate | Major | Major | - | Major | Intermediate | Minor |
Pivot points can also be used to set your price objectives. Here is the price situation in relation to pivot points:
| Pivot points | S3 | S2 | S1 | PP | R1 | R2 | R3 |
|---|---|---|---|---|---|---|---|
| Standard | 186.47 | 187.61 | 189.75 | 190.89 | 193.03 | 194.17 | 196.31 |
| Camarilla | 190.99 | 191.29 | 191.59 | 191.89 | 192.19 | 192.49 | 192.79 |
| Woodie | 186.97 | 187.86 | 190.25 | 191.14 | 193.53 | 194.42 | 196.81 |
| Fibonacci | 187.61 | 188.86 | 189.64 | 190.89 | 192.14 | 192.92 | 194.17 |
| Pivot points | S3 | S2 | S1 | PP | R1 | R2 | R3 |
|---|---|---|---|---|---|---|---|
| Standard | 173.69 | 176.89 | 182.01 | 185.21 | 190.33 | 193.53 | 198.65 |
| Camarilla | 184.83 | 185.60 | 186.36 | 187.12 | 187.88 | 188.65 | 189.41 |
| Woodie | 174.64 | 177.37 | 182.96 | 185.69 | 191.28 | 194.01 | 199.60 |
| Fibonacci | 176.89 | 180.07 | 182.04 | 185.21 | 188.39 | 190.36 | 193.53 |
| Pivot points | S3 | S2 | S1 | PP | R1 | R2 | R3 |
|---|---|---|---|---|---|---|---|
| Standard | 171.15 | 181.67 | 187.09 | 197.61 | 203.03 | 213.55 | 218.97 |
| Camarilla | 188.14 | 189.60 | 191.06 | 192.52 | 193.98 | 195.44 | 196.90 |
| Woodie | 168.61 | 180.40 | 184.55 | 196.34 | 200.49 | 212.28 | 216.43 |
| Fibonacci | 181.67 | 187.76 | 191.52 | 197.61 | 203.70 | 207.46 | 213.55 |
Numerical data
The following is the status of the technical indicators and moving averages at the time of publication of this technical analysis:
| RSI (14): | 46.19 | |
| MACD (12,26,9): | 1.1900 | |
| Directional Movement: | -10.48 | |
| AROON (14): | -28.57 | |
| DEMA (21): | 198.02 | |
| Parabolic SAR (0,02-0,02-0,2): | 205.44 | |
| Elder Ray (13): | -6.44 | |
| Super Trend (3,10): | 199.45 | |
| Zig ZAG (10): | 191.94 | |
| VORTEX (21): | 0.9700 | |
| Stochastique (14,3,5): | 22.89 | |
| TEMA (21): | 196.06 | |
| Williams %R (14): | -57.89 | |
| Chande Momentum Oscillator (20): | -8.01 | |
| Repulse (5,40,3): | 0.2800 | |
| ROCnROLL: | -1 | |
| TRIX (15,9): | 0.2400 | |
| Courbe Coppock: | 1.41 |
| MA7: | 189.26 | |
| MA20: | 192.11 | |
| MA50: | 198.79 | |
| MA100: | 197.05 | |
| MAexp7: | 194.47 | |
| MAexp20: | 195.54 | |
| MAexp50: | 190.27 | |
| MAexp100: | 181.80 | |
| Price / MA7: | +1.33% | |
| Price / MA20: | -0.17% | |
| Price / MA50: | -3.53% | |
| Price / MA100: | -2.67% | |
| Price / MAexp7: | -1.38% | |
| Price / MAexp20: | -1.92% | |
| Price / MAexp50: | +0.79% | |
| Price / MAexp100: | +5.49% |
News
The last news published on GBP/JPY at the time of the generation of this analysis was as follows:
-
 GBP/JPY Forecast August 15, 2024
-
GBP/JPY Forecast August 12, 2024
-
GBP/JPY Forecast August 2, 2024
-
GBP/JPY Forecast July 31, 2024
-
GBP/JPY Forecast July 24, 2024
About author

Online


Add a comment
Comments
0 comments on the analysis GBP/JPY - Weekly