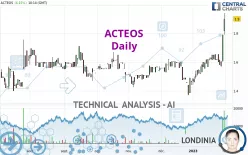
ACTEOS - Daily - Technical analysis published on 01/31/2023 (GMT)
- 203
- 0
Click here for a new analysis!
- Timeframe : Daily
- - Analysis generated on
- Status : INVALID

Summary of the analysis

Additional analysis
Quotes
The ACTEOS price is 1.900 EUR. The price registered an increase of +6.15% on the session and was between 1.790 EUR and 1.940 EUR. This implies that the price is at +6.15% from its lowest and at -2.06% from its highest.The Central Gaps scanner detects a bullish gap which is a sign that buyers have taken the lead in the very short term.
Opening Gap UP
Type : Bullish
Timeframe : Openning
A study of price movements over other periods shows the following variations:
New HIGH record (1st january)
Type : Bullish
Timeframe : Weekly
New HIGH record (1 month)
Type : Bullish
Timeframe : Weekly
Abnormal volumes on ACTEOS were detected by the Central Volumes scanner:
Abnormal volumes
Timeframe : 5 days
Technical
Technical analysis of this Daily chart of ACTEOS indicates that the overall trend is strongly bullish. 92.86% of the signals given by moving averages are bullish. The overall trend is supported by the strong bullish signals from short-term moving averages. The Central Indicators market scanner currently does not detect any result that concerns moving averages.
In fact, according to the parameters integrated into the Central Analyzer system, 17 technical indicators out of 18 analysed are currently bullish. Caution: the Central Indicators scanner currently detects an excess:
RSI indicator is overbought : over 70
Type : Neutral
Timeframe : Daily
CCI indicator is overbought : over 100
Type : Neutral
Timeframe : Daily
Previous candle closed over Bollinger bands
Type : Neutral
Timeframe : Daily
Pivot points : price is over resistance 1
Type : Neutral
Timeframe : Daily
Pivot points : price is over resistance 3
Type : Neutral
Timeframe : Weekly
Central Patterns, the market scanner focusing on chart patterns, resistances and supports found these results:
Near horizontal resistance
Type : Bearish
Timeframe : Daily
Resistance of channel is broken
Type : Bullish
Timeframe : Daily
From the Japanese candlestick perspective, the Central Candlesticks scanner notes the presence of these results that could impact the short-term trend:
Black gravestone / inverted hammer
Type : Bearish
Timeframe : Daily
Long white line
Type : Bullish
Timeframe : Daily
| S3 | S2 | S1 | Price | R1 | R2 | R3 | |
|---|---|---|---|---|---|---|---|
| ProTrendLines | 1.619 | 1.706 | 1.880 | 1.900 | 1.965 | 2.040 | 2.269 |
| Change (%) | -14.79% | -10.21% | -1.05% | - | +3.42% | +7.37% | +19.42% |
| Change | -0.281 | -0.194 | -0.020 | - | +0.065 | +0.140 | +0.369 |
| Level | Intermediate | Major | Minor | - | Minor | Minor | Intermediate |
Attention could also be paid to pivot points to set price objectives:
| Pivot points | S3 | S2 | S1 | PP | R1 | R2 | R3 |
|---|---|---|---|---|---|---|---|
| Standard | 1.482 | 1.543 | 1.667 | 1.728 | 1.852 | 1.913 | 2.037 |
| Camarilla | 1.739 | 1.756 | 1.773 | 1.790 | 1.807 | 1.824 | 1.841 |
| Woodie | 1.513 | 1.559 | 1.698 | 1.744 | 1.883 | 1.929 | 2.068 |
| Fibonacci | 1.543 | 1.614 | 1.658 | 1.728 | 1.799 | 1.843 | 1.913 |
| Pivot points | S3 | S2 | S1 | PP | R1 | R2 | R3 |
|---|---|---|---|---|---|---|---|
| Standard | 1.457 | 1.513 | 1.542 | 1.598 | 1.627 | 1.683 | 1.712 |
| Camarilla | 1.547 | 1.554 | 1.562 | 1.570 | 1.578 | 1.586 | 1.593 |
| Woodie | 1.443 | 1.506 | 1.528 | 1.591 | 1.613 | 1.676 | 1.698 |
| Fibonacci | 1.513 | 1.546 | 1.566 | 1.598 | 1.631 | 1.651 | 1.683 |
| Pivot points | S3 | S2 | S1 | PP | R1 | R2 | R3 |
|---|---|---|---|---|---|---|---|
| Standard | 1.103 | 1.237 | 1.353 | 1.487 | 1.603 | 1.737 | 1.853 |
| Camarilla | 1.401 | 1.424 | 1.447 | 1.470 | 1.493 | 1.516 | 1.539 |
| Woodie | 1.095 | 1.233 | 1.345 | 1.483 | 1.595 | 1.733 | 1.845 |
| Fibonacci | 1.237 | 1.332 | 1.391 | 1.487 | 1.582 | 1.641 | 1.737 |
Numerical data
The following are the details of the technical indicators and moving averages that were collected to generate this technical analysis:
| RSI (14): | 75.66 | |
| MACD (12,26,9): | 0.0530 | |
| Directional Movement: | 42.358 | |
| AROON (14): | 92.857 | |
| DEMA (21): | 1.690 | |
| Parabolic SAR (0,02-0,02-0,2): | 1.570 | |
| Elder Ray (13): | 0.203 | |
| Super Trend (3,10): | 1.669 | |
| Zig ZAG (10): | 1.900 | |
| VORTEX (21): | 1.2390 | |
| Stochastique (14,3,5): | 73.87 | |
| TEMA (21): | 1.732 | |
| Williams %R (14): | -10.39 | |
| Chande Momentum Oscillator (20): | 0.310 | |
| Repulse (5,40,3): | 12.9350 | |
| ROCnROLL: | 1 | |
| TRIX (15,9): | 0.2620 | |
| Courbe Coppock: | 17.55 |
| MA7: | 1.672 | |
| MA20: | 1.614 | |
| MA50: | 1.570 | |
| MA100: | 1.560 | |
| MAexp7: | 1.711 | |
| MAexp20: | 1.632 | |
| MAexp50: | 1.586 | |
| MAexp100: | 1.578 | |
| Price / MA7: | +13.64% | |
| Price / MA20: | +17.72% | |
| Price / MA50: | +21.02% | |
| Price / MA100: | +21.79% | |
| Price / MAexp7: | +11.05% | |
| Price / MAexp20: | +16.42% | |
| Price / MAexp50: | +19.80% | |
| Price / MAexp100: | +20.41% |
News
The latest news and videos published on ACTEOS at the time of the analysis were as follows:
About author
Online


Add a comment
Comments
0 comments on the analysis ACTEOS - Daily