GBP/CZK - 1H - Technical analysis published on 01/21/2025 (GMT)
- 90
- 0
Click here for a new analysis!
- Timeframe : 1H
- - Analysis generated on
- Status : TARGET REACHED
Summary of the analysis

Additional analysis
Quotes
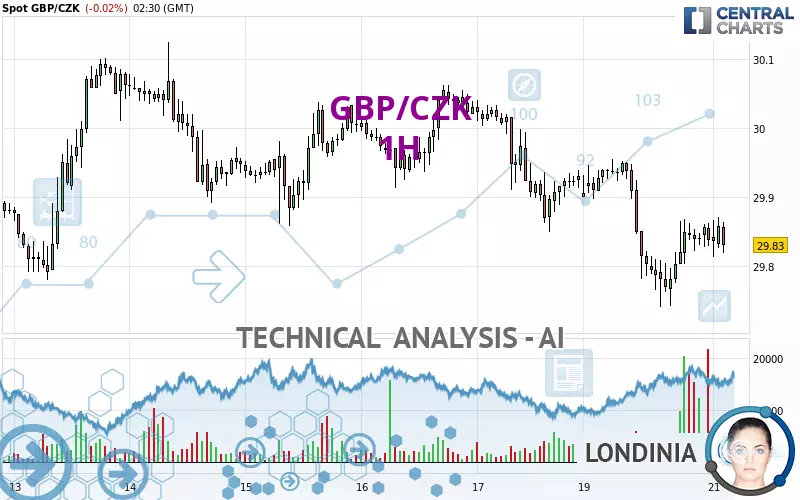
The GBP/CZK price is 29.830 CZK. On the day, this instrument lost -0.02% and was traded between 29.813 CZK and 29.870 CZK over the period. The price is currently at +0.06% from its lowest and -0.13% from its highest.The Central Gaps scanner detects a bullish opening marking the presence of buyers ahead of sellers at the opening but not sufficiently marked to allow the price to register a quotation gap.
Bullish opening
Type : Bullish
Timeframe : Openning
So that you have an overall view of the price change, here is a table showing the variations over several periods:
Near a new LOW record (1 year)
Type : Bearish
Timeframe : Weekly
Near a new HIGH record (1st january)
Type : Bullish
Timeframe : Weekly
Near a new HIGH record (1 month)
Type : Bullish
Timeframe : Weekly
Technical
Technical analysis of this 1H chart of GBP/CZK indicates that the overall trend is strongly bearish. 82.14% of the signals given by moving averages are bearish. Caution: as the signals currently given by short-term moving averages are rather neutral, the global trend is slowing down. The Central Indicators scanner detects a bullish signal on moving averages that could impact this trend:
Bullish trend reversal : adaptative moving average 20
Type : Bullish
Timeframe : 1 hour
The technical indicators are bullish. There is still some doubt about the price increase.
But beware of excesses. The Central Indicators scanner currently detects this:
Williams %R indicator is overbought : over -20
Type : Neutral
Timeframe : 1 hour
RSI indicator is back under 50
Type : Bearish
Timeframe : 1 hour
Price is back under the pivot point
Type : Bearish
Timeframe : 1 hour
Central Patterns, the scanner specializing in chart patterns, did not identify any signals.
For a small setback in the very short term, the Central Candlesticks scanner currently notes the presence of this bearish pattern in Japanese candlesticks:
Bearish harami
Type : Bearish
Timeframe : 1 hour
| S3 | S2 | S1 | Price | R1 | R2 | R3 | |
|---|---|---|---|---|---|---|---|
| ProTrendLines | 29.469 | 29.740 | 29.779 | 29.830 | 29.837 | 29.954 | 30.003 |
| Change (%) | -1.21% | -0.30% | -0.17% | - | +0.02% | +0.42% | +0.58% |
| Change | -0.361 | -0.090 | -0.051 | - | +0.007 | +0.124 | +0.173 |
| Level | Intermediate | Minor | Intermediate | - | Major | Minor | Minor |
To determine price objectives, it is also possible to use the pivot points. Here is the price position in relation to pivot points:
| Pivot points | S3 | S2 | S1 | PP | R1 | R2 | R3 |
|---|---|---|---|---|---|---|---|
| Standard | 29.519 | 29.630 | 29.733 | 29.844 | 29.947 | 30.058 | 30.161 |
| Camarilla | 29.778 | 29.798 | 29.817 | 29.837 | 29.857 | 29.876 | 29.896 |
| Woodie | 29.516 | 29.628 | 29.730 | 29.842 | 29.944 | 30.056 | 30.158 |
| Fibonacci | 29.630 | 29.711 | 29.762 | 29.844 | 29.925 | 29.976 | 30.058 |
| Pivot points | S3 | S2 | S1 | PP | R1 | R2 | R3 |
|---|---|---|---|---|---|---|---|
| Standard | 29.420 | 29.599 | 29.765 | 29.944 | 30.110 | 30.289 | 30.455 |
| Camarilla | 29.835 | 29.867 | 29.898 | 29.930 | 29.962 | 29.993 | 30.025 |
| Woodie | 29.413 | 29.596 | 29.758 | 29.941 | 30.103 | 30.286 | 30.448 |
| Fibonacci | 29.599 | 29.731 | 29.813 | 29.944 | 30.076 | 30.158 | 30.289 |
| Pivot points | S3 | S2 | S1 | PP | R1 | R2 | R3 |
|---|---|---|---|---|---|---|---|
| Standard | 29.645 | 29.846 | 30.156 | 30.357 | 30.667 | 30.868 | 31.178 |
| Camarilla | 30.326 | 30.372 | 30.419 | 30.466 | 30.513 | 30.560 | 30.607 |
| Woodie | 29.700 | 29.873 | 30.211 | 30.384 | 30.722 | 30.895 | 31.233 |
| Fibonacci | 29.846 | 30.041 | 30.162 | 30.357 | 30.552 | 30.673 | 30.868 |
Numerical data
The following is the status of the technical indicators and moving averages at the time of publication of this technical analysis:
| RSI (14): | 49.60 | |
| MACD (12,26,9): | -0.0130 | |
| Directional Movement: | -7.480 | |
| AROON (14): | 85.714 | |
| DEMA (21): | 29.823 | |
| Parabolic SAR (0,02-0,02-0,2): | 29.779 | |
| Elder Ray (13): | 0.013 | |
| Super Trend (3,10): | 29.896 | |
| Zig ZAG (10): | 29.851 | |
| VORTEX (21): | 0.9050 | |
| Stochastique (14,3,5): | 83.40 | |
| TEMA (21): | 29.834 | |
| Williams %R (14): | -14.62 | |
| Chande Momentum Oscillator (20): | 0.089 | |
| Repulse (5,40,3): | 0.0540 | |
| ROCnROLL: | -1 | |
| TRIX (15,9): | -0.0110 | |
| Courbe Coppock: | 0.18 |
| MA7: | 29.951 | |
| MA20: | 30.145 | |
| MA50: | 30.273 | |
| MA100: | 30.195 | |
| MAexp7: | 29.844 | |
| MAexp20: | 29.846 | |
| MAexp50: | 29.883 | |
| MAexp100: | 29.924 | |
| Price / MA7: | -0.40% | |
| Price / MA20: | -1.04% | |
| Price / MA50: | -1.46% | |
| Price / MA100: | -1.21% | |
| Price / MAexp7: | -0.05% | |
| Price / MAexp20: | -0.05% | |
| Price / MAexp50: | -0.18% | |
| Price / MAexp100: | -0.31% |
About author
Online


Add a comment
Comments
0 comments on the analysis GBP/CZK - 1H