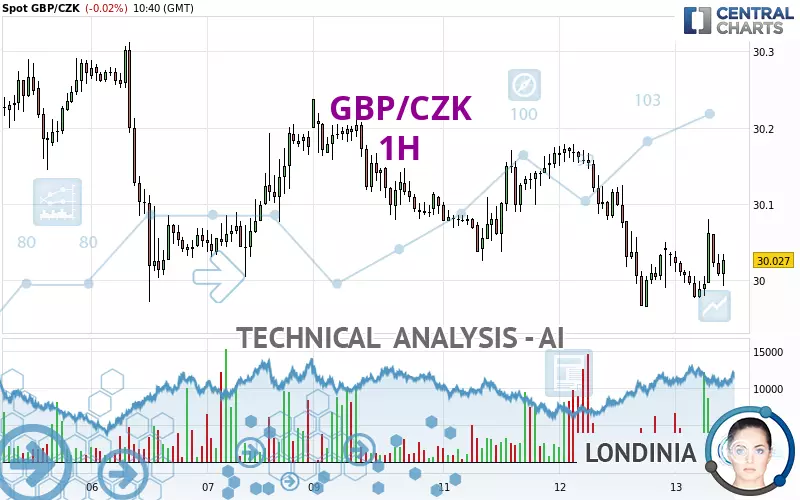
GBP/CZK - 1H - Technical analysis published on 02/13/2025 (GMT)
- 133
- 0
Click here for a new analysis!
- Timeframe : 1H
- - Analysis generated on
- Status : LEVEL MAINTAINED

Summary of the analysis

Additional analysis
Quotes
GBP/CZK rating 30.027 CZK. On the day, this instrument lost -0.02% and was between 29.977 CZK and 30.080 CZK. This implies that the price is at +0.17% from its lowest and at -0.18% from its highest.So that you have an overall view of the price change, here is a table showing the variations over several periods:
Near a new HIGH record (5 years)
Type : Bullish
Timeframe : Weekly
Near a new LOW record (1 year)
Type : Bearish
Timeframe : Weekly
Near a new HIGH record (1st january)
Type : Bullish
Timeframe : Weekly
Near a new HIGH record (1 month)
Type : Bullish
Timeframe : Weekly
Technical
Technical analysis of this 1H chart of GBP/CZK indicates that the overall trend is bearish. 75.00% of the signals given by moving averages are bearish. Caution: the neutral signals currently given by short-term moving averages show us that the global trend is losing momentum. The Central Indicators scanner detects bullish signals on moving averages that could impact this trend:
Bullish price crossover with Moving Average 20
Type : Bullish
Timeframe : 1 hour
Bullish price crossover with adaptative moving average 20
Type : Bullish
Timeframe : 1 hour
Technical indicators are slightly bullish. There is therefore considerable uncertainty about the continuation of the increase.
Central Indicators, the scanner specialised in technical indicators, has identified this signal:
Price is back under the pivot point
Type : Bearish
Timeframe : Weekly
Central Patterns, the market scanner focusing on chart patterns, resistances and supports found these results:
Near resistance of channel
Type : Bearish
Timeframe : 1 hour
Near horizontal support
Type : Bullish
Timeframe : 1 hour
The Central Candlesticks scanner which studies Japanese candlesticks did not detect anything.
| S3 | S2 | S1 | Price | R1 | R2 | R3 | |
|---|---|---|---|---|---|---|---|
| ProTrendLines | 29.285 | 29.837 | 30.003 | 30.027 | 30.237 | 30.313 | 30.435 |
| Change (%) | -2.47% | -0.63% | -0.08% | - | +0.70% | +0.95% | +1.36% |
| Change | -0.742 | -0.190 | -0.024 | - | +0.210 | +0.286 | +0.408 |
| Level | Intermediate | Major | Major | - | Major | Intermediate | Minor |
Pivot points can also be used to set your price objectives. Here is the price situation in relation to pivot points:
| Pivot points | S3 | S2 | S1 | PP | R1 | R2 | R3 |
|---|---|---|---|---|---|---|---|
| Standard | 29.727 | 29.846 | 29.940 | 30.059 | 30.153 | 30.272 | 30.366 |
| Camarilla | 29.975 | 29.995 | 30.015 | 30.034 | 30.054 | 30.073 | 30.093 |
| Woodie | 29.715 | 29.840 | 29.928 | 30.053 | 30.141 | 30.266 | 30.354 |
| Fibonacci | 29.846 | 29.927 | 29.978 | 30.059 | 30.140 | 30.191 | 30.272 |
| Pivot points | S3 | S2 | S1 | PP | R1 | R2 | R3 |
|---|---|---|---|---|---|---|---|
| Standard | 29.488 | 29.730 | 29.952 | 30.194 | 30.416 | 30.658 | 30.880 |
| Camarilla | 30.047 | 30.090 | 30.133 | 30.175 | 30.218 | 30.260 | 30.303 |
| Woodie | 29.479 | 29.725 | 29.943 | 30.189 | 30.407 | 30.653 | 30.871 |
| Fibonacci | 29.730 | 29.907 | 30.016 | 30.194 | 30.371 | 30.480 | 30.658 |
| Pivot points | S3 | S2 | S1 | PP | R1 | R2 | R3 |
|---|---|---|---|---|---|---|---|
| Standard | 28.902 | 29.284 | 29.705 | 30.087 | 30.508 | 30.890 | 31.311 |
| Camarilla | 29.904 | 29.978 | 30.051 | 30.125 | 30.199 | 30.272 | 30.346 |
| Woodie | 28.921 | 29.294 | 29.724 | 30.097 | 30.527 | 30.900 | 31.330 |
| Fibonacci | 29.284 | 29.591 | 29.781 | 30.087 | 30.394 | 30.584 | 30.890 |
Numerical data
The following are the details of the technical indicators and moving averages that were collected to generate this technical analysis:
| RSI (14): | 48.68 | |
| MACD (12,26,9): | -0.0170 | |
| Directional Movement: | -1.746 | |
| AROON (14): | 21.428 | |
| DEMA (21): | 30.002 | |
| Parabolic SAR (0,02-0,02-0,2): | 29.987 | |
| Elder Ray (13): | -0.007 | |
| Super Trend (3,10): | 30.077 | |
| Zig ZAG (10): | 30.031 | |
| VORTEX (21): | 0.8940 | |
| Stochastique (14,3,5): | 41.75 | |
| TEMA (21): | 30.003 | |
| Williams %R (14): | -48.54 | |
| Chande Momentum Oscillator (20): | -0.009 | |
| Repulse (5,40,3): | 0.0690 | |
| ROCnROLL: | -1 | |
| TRIX (15,9): | -0.0120 | |
| Courbe Coppock: | 0.01 |
| MA7: | 30.118 | |
| MA20: | 30.021 | |
| MA50: | 30.158 | |
| MA100: | 30.235 | |
| MAexp7: | 30.019 | |
| MAexp20: | 30.027 | |
| MAexp50: | 30.061 | |
| MAexp100: | 30.090 | |
| Price / MA7: | -0.30% | |
| Price / MA20: | +0.02% | |
| Price / MA50: | -0.43% | |
| Price / MA100: | -0.69% | |
| Price / MAexp7: | +0.03% | |
| Price / MAexp20: | -0% | |
| Price / MAexp50: | -0.11% | |
| Price / MAexp100: | -0.21% |
About author
Online


Add a comment
Comments
0 comments on the analysis GBP/CZK - 1H