| Open: | 149.37 |
| Change: | +1.39 |
| Volume: | 167,532 |
| Low: | 149.35 |
| High: | 150.76 |
| High / Low range: | 1.41 |
| Type: | Forex |
| Ticker: | EURUSD |
| ISIN: |
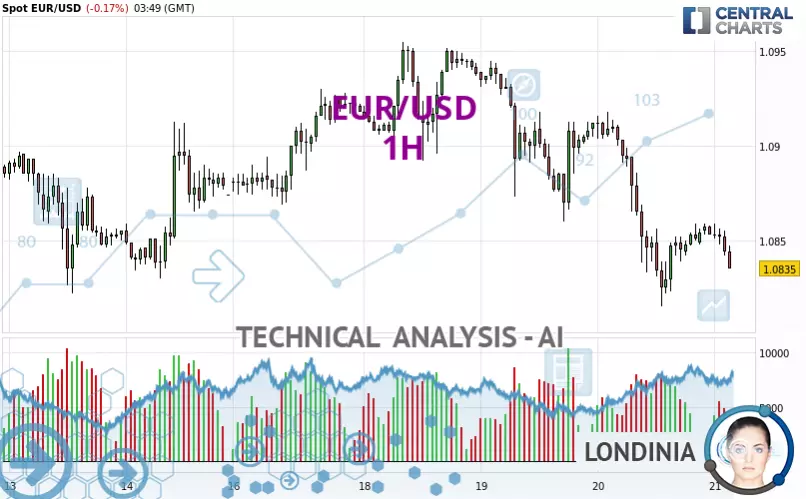
EUR/USD - 1H - Technical analysis published on 03/21/2025 (GMT)
- 227
- 0
- 03/21/2025 - 03:49
Click here for a new analysis!
- Timeframe : 1H
- - Analysis generated on 03/21/2025 - 03:49
- Status : TARGET REACHED
Summary of the analysis

Additional analysis
Quotes
The EUR/USD rating is 1.0835 USD. The price registered a decrease of -0.17% on the session and was between 1.0835 USD and 1.0859 USD. This implies that the price is at 0% from its lowest and at -0.22% from its highest.So that you have an overall view of the price change, here is a table showing the variations over several periods:
Near a new HIGH record (1 year)
Type : Bullish
Timeframe : Weekly
Near a new HIGH record (1st january)
Type : Bullish
Timeframe : Weekly
Near a new LOW record (1 month)
Type : Bearish
Timeframe : Weekly
Technical
Technical analysis of this 1H chart of EUR/USD indicates that the overall trend is strongly bearish. The signals given by moving averages are 92.86% bearish. This strong bearish trend is confirmed by the strong signals currently being given by short-term moving averages. The Central Indicators scanner does not detect any result on moving averages that would impact this trend.
In fact, of the 18 technical indicators analysed by Central Analyzer, 4 are bullish, 6 are neutral and 8 are bearish. Central Indicators, the scanner specialised in technical indicators, has identified these signals:
Price is back under the pivot point (Daily)
Type : Bearish
Timeframe : Weekly
Momentum indicator is back under 0
Type : Bearish
Timeframe : 1 hour
Williams %R indicator is back under -50
Type : Bearish
Timeframe : 1 hour
Central Patterns, the market scanner focusing on chart patterns, resistances and supports found these results:
Near horizontal support
Type : Bullish
Timeframe : 1 hour
Support of channel is broken
Type : Bearish
Timeframe : 1 hour
There is also a Japanese candlestick pattern detected by Central Candlesticks that could mark the end of the current short-term trend:
Doji
Type : Neutral
Timeframe : 1 hour
| S3 | S2 | S1 | Price | R1 | R2 | R3 | |
|---|---|---|---|---|---|---|---|
| ProTrendLines | 1.0698 | 1.0783 | 1.0822 | 1.0835 | 1.0856 | 1.0876 | 1.0918 |
| Change (%) | -1.26% | -0.48% | -0.12% | - | +0.19% | +0.38% | +0.77% |
| Change | -0.0137 | -0.0052 | -0.0013 | - | +0.0021 | +0.0041 | +0.0083 |
| Level | Minor | Minor | Major | - | Major | Minor | Intermediate |
To determine price objectives, it is also possible to use the pivot points. Here is the price position in relation to pivot points:
| Pivot points | S3 | S2 | S1 | PP | R1 | R2 | R3 |
|---|---|---|---|---|---|---|---|
| Standard | 1.0703 | 1.0759 | 1.0806 | 1.0862 | 1.0909 | 1.0965 | 1.1012 |
| Camarilla | 1.0825 | 1.0834 | 1.0844 | 1.0853 | 1.0862 | 1.0872 | 1.0881 |
| Woodie | 1.0699 | 1.0757 | 1.0802 | 1.0860 | 1.0905 | 1.0963 | 1.1008 |
| Fibonacci | 1.0759 | 1.0798 | 1.0823 | 1.0862 | 1.0901 | 1.0926 | 1.0965 |
| Pivot points | S3 | S2 | S1 | PP | R1 | R2 | R3 |
|---|---|---|---|---|---|---|---|
| Standard | 1.0662 | 1.0733 | 1.0804 | 1.0875 | 1.0946 | 1.1017 | 1.1088 |
| Camarilla | 1.0835 | 1.0848 | 1.0861 | 1.0874 | 1.0887 | 1.0900 | 1.0913 |
| Woodie | 1.0661 | 1.0733 | 1.0803 | 1.0875 | 1.0945 | 1.1017 | 1.1087 |
| Fibonacci | 1.0733 | 1.0788 | 1.0821 | 1.0875 | 1.0930 | 1.0963 | 1.1017 |
| Pivot points | S3 | S2 | S1 | PP | R1 | R2 | R3 |
|---|---|---|---|---|---|---|---|
| Standard | 0.9891 | 1.0049 | 1.0213 | 1.0371 | 1.0535 | 1.0693 | 1.0857 |
| Camarilla | 1.0289 | 1.0318 | 1.0348 | 1.0377 | 1.0407 | 1.0436 | 1.0466 |
| Woodie | 0.9894 | 1.0051 | 1.0216 | 1.0373 | 1.0538 | 1.0695 | 1.0860 |
| Fibonacci | 1.0049 | 1.0172 | 1.0248 | 1.0371 | 1.0494 | 1.0570 | 1.0693 |
Numerical data
The following is the status of technical indicators and moving averages registered at the time this technical analysis was created:
| RSI (14): | 34.64 | |
| MACD (12,26,9): | -0.0010 | |
| Directional Movement: | -18.0429 | |
| AROON (14): | 50.0000 | |
| DEMA (21): | 1.0840 | |
| Parabolic SAR (0,02-0,02-0,2): | 1.0827 | |
| Elder Ray (13): | -0.0009 | |
| Super Trend (3,10): | 1.0877 | |
| Zig ZAG (10): | 1.0837 | |
| VORTEX (21): | 0.8297 | |
| Stochastique (14,3,5): | 63.51 | |
| TEMA (21): | 1.0841 | |
| Williams %R (14): | -62.16 | |
| Chande Momentum Oscillator (20): | -0.0011 | |
| Repulse (5,40,3): | -0.1919 | |
| ROCnROLL: | 2 | |
| TRIX (15,9): | -0.0164 | |
| Courbe Coppock: | 0.04 |
| MA7: | 1.0884 | |
| MA20: | 1.0729 | |
| MA50: | 1.0527 | |
| MA100: | 1.0523 | |
| MAexp7: | 1.0846 | |
| MAexp20: | 1.0855 | |
| MAexp50: | 1.0874 | |
| MAexp100: | 1.0884 | |
| Price / MA7: | -0.45% | |
| Price / MA20: | +0.99% | |
| Price / MA50: | +2.93% | |
| Price / MA100: | +2.96% | |
| Price / MAexp7: | -0.10% | |
| Price / MAexp20: | -0.18% | |
| Price / MAexp50: | -0.36% | |
| Price / MAexp100: | -0.45% |
News
The last news published on EUR/USD at the time of the generation of this analysis was as follows:
-
03/18/2025 - 17:01
 EUR/USD Analysis: Can the Euro Continue with Fed Meeting Here?
-
03/17/2025 - 15:02
Technical Outlook on EURUSD, USDJPY, GBPUSD
-
03/10/2025 - 16:17
EUR/USD Analysis: Can the Euro Continue to Rise?
-
03/06/2025 - 19:17
EUR/USD Analysis: Will the Euro Pull Back?
-
03/06/2025 - 10:33
Technical Analysis on EURUSD, GBPUSD, Oil
About author

Online


Add a comment
Comments
0 comments on the analysis EUR/USD - 1H