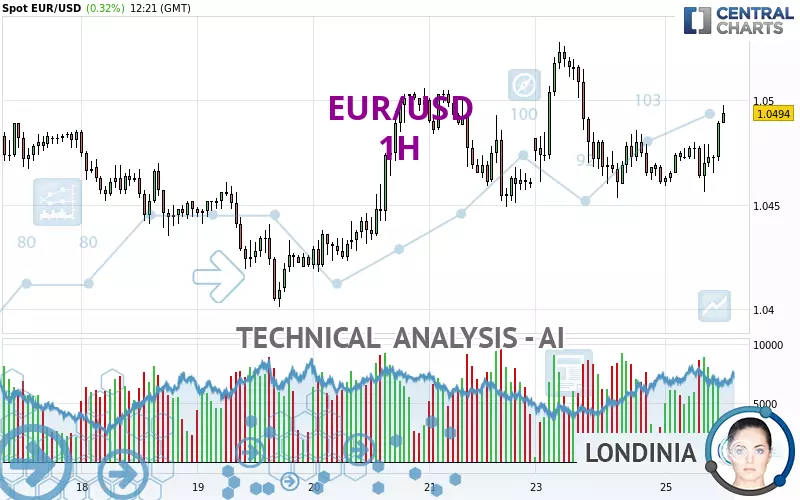
EUR/USD - 1H - Technical analysis published on 02/25/2025 (GMT)
- 64
- 0
Click here for a new analysis!
- Timeframe : 1H
- - Analysis generated on
- Status : TARGET REACHED

Summary of the analysis

Additional analysis
Quotes
The EUR/USD rating is 1.0494 USD. On the day, this instrument gained +0.32% and was traded between 1.0456 USD and 1.0498 USD over the period. The price is currently at +0.36% from its lowest and -0.04% from its highest.So that you have an overall view of the price change, here is a table showing the variations over several periods:
Near a new LOW record (1 year)
Type : Bearish
Timeframe : Weekly
Near a new LOW record (1st january)
Type : Bearish
Timeframe : Weekly
Near a new LOW record (1 month)
Type : Bearish
Timeframe : Weekly
Technical
Technical analysis of EUR/USD in 1H shows a strongly overall bullish trend. 89.29% of the signals given by moving averages are bullish. This strongly bullish trend is supported by the strong bullish signals given by short-term moving averages. The Central Indicators market scanner is currently detecting a bullish signal that could impact this trend:
Bullish trend reversal : adaptative moving average 50
Type : Bullish
Timeframe : 1 hour
An assessment of technical indicators shows a strong bullish signal.
Caution: the Central Indicators scanner currently detects an excess:
CCI indicator is overbought : over 100
Type : Neutral
Timeframe : 1 hour
Previous candle closed over Bollinger bands
Type : Neutral
Timeframe : 1 hour
Williams %R indicator is overbought : over -20
Type : Neutral
Timeframe : 1 hour
Ichimoku : price is over the cloud
Type : Bullish
Timeframe : 1 hour
MACD indicator is back over 0
Type : Bullish
Timeframe : 1 hour
Central Patterns, the scanner specializing in chart patterns, did not identify any signals.
The Central Candlesticks scanner, specialised in Japanese candlesticks, did not identify any signals.
| S3 | S2 | S1 | Price | R1 | R2 | R3 | |
|---|---|---|---|---|---|---|---|
| ProTrendLines | 1.0453 | 1.0470 | 1.0486 | 1.0494 | 1.0506 | 1.0528 | 1.0783 |
| Change (%) | -0.39% | -0.23% | -0.08% | - | +0.11% | +0.32% | +2.75% |
| Change | -0.0041 | -0.0024 | -0.0008 | - | +0.0012 | +0.0034 | +0.0289 |
| Level | Intermediate | Minor | Minor | - | Intermediate | Minor | Minor |
Attention could also be paid to pivot points to set price objectives:
| Pivot points | S3 | S2 | S1 | PP | R1 | R2 | R3 |
|---|---|---|---|---|---|---|---|
| Standard | 1.0358 | 1.0406 | 1.0433 | 1.0481 | 1.0508 | 1.0556 | 1.0583 |
| Camarilla | 1.0440 | 1.0447 | 1.0454 | 1.0461 | 1.0468 | 1.0475 | 1.0482 |
| Woodie | 1.0349 | 1.0401 | 1.0424 | 1.0476 | 1.0499 | 1.0551 | 1.0574 |
| Fibonacci | 1.0406 | 1.0434 | 1.0452 | 1.0481 | 1.0509 | 1.0527 | 1.0556 |
| Pivot points | S3 | S2 | S1 | PP | R1 | R2 | R3 |
|---|---|---|---|---|---|---|---|
| Standard | 1.0299 | 1.0350 | 1.0405 | 1.0456 | 1.0511 | 1.0562 | 1.0617 |
| Camarilla | 1.0431 | 1.0441 | 1.0450 | 1.0460 | 1.0470 | 1.0479 | 1.0489 |
| Woodie | 1.0301 | 1.0351 | 1.0407 | 1.0457 | 1.0513 | 1.0563 | 1.0619 |
| Fibonacci | 1.0350 | 1.0391 | 1.0416 | 1.0456 | 1.0497 | 1.0522 | 1.0562 |
| Pivot points | S3 | S2 | S1 | PP | R1 | R2 | R3 |
|---|---|---|---|---|---|---|---|
| Standard | 0.9829 | 1.0004 | 1.0184 | 1.0359 | 1.0539 | 1.0714 | 1.0894 |
| Camarilla | 1.0267 | 1.0300 | 1.0333 | 1.0365 | 1.0398 | 1.0430 | 1.0463 |
| Woodie | 0.9833 | 1.0005 | 1.0188 | 1.0360 | 1.0543 | 1.0715 | 1.0898 |
| Fibonacci | 1.0004 | 1.0139 | 1.0223 | 1.0359 | 1.0494 | 1.0578 | 1.0714 |
Numerical data
The following are the details of the technical indicators and moving averages that were collected to generate this technical analysis:
| RSI (14): | 60.24 | |
| MACD (12,26,9): | 0.0001 | |
| Directional Movement: | 3.9421 | |
| AROON (14): | 28.5714 | |
| DEMA (21): | 1.0476 | |
| Parabolic SAR (0,02-0,02-0,2): | 1.0457 | |
| Elder Ray (13): | 0.0014 | |
| Super Trend (3,10): | 1.0497 | |
| Zig ZAG (10): | 1.0492 | |
| VORTEX (21): | 1.1330 | |
| Stochastique (14,3,5): | 88.42 | |
| TEMA (21): | 1.0479 | |
| Williams %R (14): | 0.00 | |
| Chande Momentum Oscillator (20): | 0.0031 | |
| Repulse (5,40,3): | 0.2239 | |
| ROCnROLL: | 1 | |
| TRIX (15,9): | -0.0024 | |
| Courbe Coppock: | 0.19 |
| MA7: | 1.0467 | |
| MA20: | 1.0414 | |
| MA50: | 1.0389 | |
| MA100: | 1.0543 | |
| MAexp7: | 1.0481 | |
| MAexp20: | 1.0476 | |
| MAexp50: | 1.0475 | |
| MAexp100: | 1.0468 | |
| Price / MA7: | +0.26% | |
| Price / MA20: | +0.77% | |
| Price / MA50: | +1.01% | |
| Price / MA100: | -0.46% | |
| Price / MAexp7: | +0.12% | |
| Price / MAexp20: | +0.17% | |
| Price / MAexp50: | +0.18% | |
| Price / MAexp100: | +0.25% |
News
The last news published on EUR/USD at the time of the generation of this analysis was as follows:
-
 EUR/USD Analysis: Are We at the Top?
-
EUR/USD Long Position Success & USD/JPY Short Setup | Trade of the Week February 2025
-
EUR/USD trading strategy: how Trump's tariffs changed everything | Trade of the Week February 2025
-
EUR/USD Analysis: Can the Euro Continue to Rise?
-
Technical Outlook on EURUSD, USDJPY, GBPUSD
About author

Online


Add a comment
Comments
0 comments on the analysis EUR/USD - 1H